Quarterly data
Time series : Agr2.1_EN.xls
| N | Description | Links | Indices to base: | ||
|---|---|---|---|---|---|
| 2020=100 | corresponding quarter in preceding year | preceding year=100 | |||
| 1 | Total | 1=2+3+4+10+14+ 15+18+19+20 |
133.0 | 99.6 | 99.7 |
| 2 | Seeds and planting stocks | 2 | 153.0 | 104.3 | 102.2 |
| 3 | Energy; Lubricants | 3 | 127.5 | 92.4 | 94.6 |
| 4 | Fertilisers and soil improvers | 4=5+9 | 136.0 | 98.4 | 99.4 |
| 5 | Straight fertilizers | 5=6+7+8 | 135.9 | 99.1 | 99.4 |
| 6 | Nitrogenous fertilizers | 6 | 142.2 | 99.1 | 99.7 |
| 7 | Phosphatic fertilizers | 7 | 123.8 | 97.1 | 96.2 |
| 8 | Potassic fertilizers | 8 | 90.8 | 103.6 | 104.3 |
| 9 | Compound fertilizers | 9 | 136.5 | 96.3 | 99.5 |
| 10 | Plant protection products and pesticides | 10=11+12+13 | 103.0 | 99.4 | 99.0 |
| 11 | Fungicides | 11 | 100.8 | 99.6 | 99.6 |
| 12 | Insecticides | 12 | 100.1 | 100.1 | 99.7 |
| 13 | Herbicides | 13 | 105.2 | 99.0 | 98.3 |
| 14 | Veterinary-medical products | 14 | 129.6 | 104.7 | 104.8 |
| 15 | Animal feeding stuffs | 15=16+17 | 144.2 | 102.1 | 100.7 |
| 16 | Straight feeding stuffs | 16 | 133.4 | 104.9 | 103.7 |
| 17 | Compound feeding stuffs | 17 | 149.9 | 99.8 | 98.1 |
| 18 | Maintenance of materials | 18 | 141.6 | 108.8 | 107.9 |
| 19 | Maintenance of buildings | 19 | 149.7 | 104.7 | 104.5 |
| 20 | Other goods and services | 20 | 122.8 | 100.8 | 100.2 |
| N | Description | Links | Indices to base: | ||
|---|---|---|---|---|---|
| 2020=100 | corresponding quarter in preceding year | preceding year=100 | |||
| 21 | Total | 21=22+26 | 137.1 | 98.4 | 103.7 |
| 22 | Materials | 22=23+24 | 153.5 | 95.9 | 103.3 |
| 23 | Machinery and other equipment | 23 | 157.5 | 96.4 | 104.6 |
| 24 | Transport equipment | 24=25 | 120.9 | 92.7 | 94.1 |
| 25 | Tractors | 25 | 120.9 | 92.7 | 94.1 |
| 26 | Buildings | 26 | 106.0 | 104.0 | 104.7 |
| N | Description | Links | Indices to base: | ||
|---|---|---|---|---|---|
| 2020=100 | corresponding quarter in preceding year | preceding year=100 | |||
| 27 | Total | 27=1+21 | 133.7 | 99.4 | 100.5 |
15.08.2025
| Contact | |
|---|---|
| Contact organisation | National Statistical Institute |
| Contact organisation unit | Agriculture and Forestry |
| Contact name | Raya Petrova Marta Georgieva, PhD Petya Mitrova |
| Contact person function | State expert Chief expert Junior expert |
| Contact mail address | 2, P. Volov Str.; 1038 Sofia, |
| Contact email address | |
| Contact phone number | +359 2 9857 159 +359 2 9857 433 +359 2 9857154 |
| Contact fax number | |
| Metadata update | |
| Metadata last certified | 16 December 2025 |
| Metadata last posted | 16 December 2025 |
| Metadata last update | 16 December 2025 |
| Statistical presentation | |
| Data description | The data are developed in compliance with the Regulation (EU) 2022/2379 on SAIO adopted on 23.11.2022, in force from 1 January 2025. Thus achieving harmonization in the field of price statistics and indices in agriculture with the EU practice with regard of definitions, techniques of price registration, type of calculated indices, survey periodicity and classifications used. Two data sets are calculated: · Prices of goods and services currently consumed in agriculture (quarterly and annual); · Price Indices of goods and services currently consumed in agriculture (quarterly and annual). The purpose of the indices is to provide information about trends in purchase prices of products and services currently consumed in agriculture for comparisons between different products within a country or between Member States of the European Union, to compare trends in producer prices and the price of goods and services currently consumed in agriculture and for compilation of data on economic accounts for agriculture (as deflator for items of intermediate consumption in agriculture). |
| Classification system | Specific classifications of products and services currently consumed in agriculture are used. Classifications include representative products defined by their qualitative and quantitative characteristics of the following groups: · Fertilizers; · animal feeding stuffs; · plant protection products; · veterinary products; · planting stocks and seeds. |
| Sector coverage | The Price index is calculated at the base on purchases of products and services currently consumed in agriculture made by farm. |
| Statistical concepts and definitions | · Price of Goods and Services currently consumed in agriculture The goods and services currently consumed in agriculture are valued at purchase price, i.e. the price actually paid for the products. It includes taxes on products (excluding deductible taxes and VAT), but does not include subsidies on products. Information is collected within five surveys on prices of: fertilizers, animal feeding stuffs, plant protection products, veterinary products and planting stocks and seeds. For data collection on the prices of products and services currently consumed in agriculture representative products (most frequently purchased by agricultural holdings) are chosen, defined by their qualitative and quantitative characteristics. This way the lists with products for observation are build-up. Information is usually collected once in every five years, when the new base year appears. There is an exception for the products with great dynamics on the markets, the nomenclature of which is updated quarterly. In the second stage data on prices of the defined products is collected. According to the methodology the price of the largest purchase in quantity for each month of the reference period is taken into account. On the base of the collected prices not weighted average price of the product and simple and aggregate indices for the period are calculated. · Price Indices of Goods and Services currently consumed in agriculture The indices are calculated by the Laspeyre's formula. · Weighting scheme for the calculation of the indices. For the calculation of Price indices (Annex 2 of the Handbook) a weighting scheme should be available. Weights are calculated within the frame of the economic accounts for agriculture and they reflect the costs incurred by the farm to purchase products and services for current consumption, including purchases of plant products from other agricultural units for intermediate consumption. The weights remain the same for the four quarters (one/forth of the annual weight) for each product group. |
| Statistical unit | Farms, commercial companies, and distributors of veterinary products, plant protection products, and seed and planting materialAgricultural Holdings. |
| Statistical population | Annual Report of agricultural holdings. |
| Reference area | For all territory of the country (NUTS0). |
| Time coverage | From 2005 onwards |
| Base period | According to current European legislation, indices are calculated for 3 base period:
|
| Unit of measure | |
Per cent (%) | |
| Reference period | |
Quarter, year | |
| Institutional mandate | |
| Legal acts and other agreements | · Law on · Regulation (EU) 2022/2379 on SAIO adopted on 23.11.2022, in force from 1 January 2025; · National Statistical Programme. |
| Data sharing | Agreement between the National Statistical Institute and the Ministry of Agriculture and Food for data exchange and strategic partnership. |
| Confidentiality | |
| Confidentiality - policy | · Law on · Regulation EC/223/2009 on European |
| Confidentiality - data treatment | Personal data shall not be published, observing art. 25 of the Law on |
| Release policy | |
| Release calendar | The schedule for dissemination of statistical information is published in the Calendar for the presentation of the results of statistical surveys carried out by the NSI. |
| Release calendar access | The Calendar is available on the NSI websitehttps://www.nsi.bg/en/calendar |
| User access | Data on the Price Indices of the goods and services currently consumed in agriculture are published on the NSI website according to the Chapter 5 of the Law on |
| Frequency of dissemination | |
Quarterly and year. | |
| Accessibility and clarity | |
| News release | Quarterly press releases are disseminated on the website of the NSI. |
| Publications | · Statistical Reference Book; · Statistical Year Book. |
| On-line database | Detailed data on Price Indices of Goods and Services currently consumed in Agriculture are available to all users of the NSI website under the heading Domain statistics - Agriculture: https://www.nsi.bg/en |
| Micro-data access | Not applicable. |
| Other | Not applicable. |
| Documentation on methodology | |
| Quality documentation | Methodological inventory related to methodology used for data compilation on the Prices and Price Indices of goods and services currently consumed in agriculture in |
| Quality management | |
| Quality assurance | The methods and procedures for data calculation in compliance with the EU methodology are periodically described and documented. During the meetings of WG Eurostat "Agricultural accounts and prices" methodological issues are discussed and examples for good practices for data calculation are provided from Member States. The comparative analysis of the data with previous years is done. |
| Quality assessment | No discrepancy with EU methodology is found out. |
| Relevance | |
| User needs | · NSI - Economic Accounts for Agriculture, National Accounts; · Eurostat; · State Administration - Ministry of Agriculture and Food and other institutions; · Scientific and Research Institutes; · Business Structures; · Individuals. |
| User satisfaction | No satisfied needs of users concerning data on Price Indices of good and services currently consumed in agriculture were found out. |
| Completeness | The production of statistics is under Regulation (EU) 2022/2379 on SAIO adopted on 23.11.2022, in force from 1 January 2025. Within the scope of the study information for all significant products and services for current consumption is collected to provide representative information for the prices and price indices. |
| Accuracy and reliability | |
| Overall accuracy | Accuracy/data quality is achieved by providing by:
|
| Sampling error | Not applicable. |
| Non-sampling error | Not applicable. |
| Timeliness and punctuality | |
| Timeliness |
|
| Punctuality | Not delays in the deadlines for submission of data to Eurostat and dissemination in the Calendar for presentation of the results of statistical surveys carried out by the NSI were admitted. |
| Coherence and comparability | |
| Comparability - geographical | Data are geographically comparable for the entire period for which they are available. |
| Comparability - over time | Data are comparable over time for the entire period for which they are available. |
| Coherence - cross domain | There is data consistency between the Price Indices of Goods and Services currently consumed in agriculture and data on Consumer Price Index and Producer Prices Indices on the domestic market in industry (for fertilizers and animal feeding stuffs). There is consistency between the data on the economic accounts for agriculture in the development of weighting schemes for calculating price indices of goods and services currently consumed in agriculture. |
| Coherence - internal | Internal data consistency is ensured by monitoring the variation in the average price in comparison with the previous period. For this purpose specially developed software is used. If significant deviations are detected (+, -25% compared to the previous period) additional checks are made and sometimes extreme values are eliminated. |
| Cost and burden | |
The budget of the surveys is published in the National Statistical Programme on the NSI website. As basic criteria for response burden at this stage the time required for filling-in the questionnaire is used. Each form includes such section that respondents must complete. The time needed for filling-in the form includes also the time for data preparation. | |
| Data revision | |
| Data revision - policy | There is no established policy on data revisions. |
| Data revision - practice | NA |
| Statistical processing | |
| Source data | Questionnaires about the prices: · Fertilizers; · Animal feeding stuffs; · Plant protection products; · Veterinary products; · Planting stock and seeds. |
| Frequency of data collection | Quarterly |
| Data collection | Data collection is in accordance with a Calendar for data collection, data processing and data dissemination of statistical surveys carried out by the NSI. Data are collected by statistical form that is sent to the respondents by post. |
| Data validation | The validation of data is done by using developed software for this purpose. Software development is in accordance with the Terms of Reference, elaborated by the experts responsible for the conduction of statistical surveys. Data processing is performed at two levels: at the regional level - from experts of the RSO's, and at national level - from the experts in the NSI. |
| Data compilation | Data compilation is carried out in accordance with a Calendar for data collection, data processing and data dissemination of statistical survey carried out by the NSI. Data processing is performed by using developed software for this. The development of software is in accordance with the Terms of reference, elaborated by the experts responsible for the surveys implementation. Data processing is performed at two levels: at regional level, from the experts from the RSO's and at national level, from the experts of the NSI. At regional level, the process involves the data control, data editing, data validation and the establishment of a regional data base. At the national level, the process includes control of regional data, data editing, data validation, establishment of a national data base, data tabulation, imputation and calculation of indices. |
| Adjustment | Do not apply seasonal adjustment. The weights are equal for all four quarters with the handbook for prices. |
| Comment | |
Download in SDMX 2.1 file format: Price of goods and services currently consumed in agriculture - Price indices of goods and services currently consumed in agriculture
Metadata Structure Definition in SDMX 2.1: ESMS_MSD+BNSI+2.0+SDMX.2.1.xml
Download in SDMX 2.0 file format: Price of goods and services currently consumed in agriculture - Price indices of goods and services currently consumed in agriculture
Metadata Structure Definition in SDMX 2.0: ESMS_MSD+BNSI+2.0+SDMX.2.0.xml
Price Indices in Agriculture, Second Quarter of 2025
The producer price index in agriculture for the second quarter of 2025 increased by 15.6% in comparison with the same quarter of 2024 as a result of the increase in the crop output price index - by 26.7%, and in the animal output price index - by 5.8%.
Compared to the previous year (on an annual basis), the prices of agricultural output went up by 13.5%, as in crop output they increased by 25.5% and in animal output - by 2.9%.
In crop output, in the second quarter of 2025, compared to the same quarter of 2024, the most significant rise was recorded in the ...
Agricultural Land Prices and Rents in Agriculture in the Republic of Bulgaria in 2024
In 2024, the average price of transactions with arable land in Bulgaria reached BGN 1 697, which was 5.9% higher than in 2023. Compared to the previous year, there was an increase in the price of arable land transactions in five statistical regions: Severozapaden, Severen tsentralen, Severoiztochen, Yugoiztochen and Yugozapaden regions. A decrease was registered in Yuzhen tsentralen region.
In 2024, the average price for rent/lease of one decare of arable land reached BGN 60, which was 3.2% lower than in 2023. Compared to the previous year, there was a decrease in the price p...
Price Indices in Agriculture, First Quarter of 2025
The producer price index in agriculture for the first quarter of 2025 increased by 7.7% in comparison with the same quarter of 2024 as a result of the increase in the crop output price index - by 13.8%. The animal output price index fell by 2.0%.
Compared to the previous year (on an annual basis), the prices of agricultural output went up by 8.1%, as in crop output they increased by 12.7% and in animal output - by 0.8%.
In crop output, in the first quarter of 2025, compared to the same quarter of 2024, the most significant rise was recorded in the prices of ind...
Price Indices in Agriculture, Fourth Quarter of 2024
The producer price index in agriculture for the fourth quarter of 2024 increased by 8.6% in comparison with the same quarter of 2023 as a result of the increase in the crop output price index - by 11.5%, and in the animal output price index - by 0.9%.
Compared to the previous year (on an annual basis), the prices of agricultural output went up by 3.1%, as in crop output they increased by 4.5% and in animal output they fell by 0.6%.
In crop output, in the fourth quarter of 2024, compared to the same quarter of 2023, the most significant rise was recorded in the prices of ...
Economic Accounts for Agriculture for 2024 (First Estimate)
According to the first estimate of the Economic Accounts for Agriculture, the final output of the ‘Agricultural industry' at basic prices in 2024 amounted to 9 440.6 million BGN. The gross value added at basic prices decreased by 9.9% on an annual basis and reached 3 798.9 million BGN, and the net entrepreneurial income is 889.1 million BGN.
...Price Indices in Agriculture, Third Quarter of 2024
The producer price index in agriculture for the third quarter of 2024 decreased by 1.9% in comparison with the same quarter of 2023 as a result of а decline in the price index of crop output - by 1.4% and in the index of animal output - by 3.9%.
In the third quarter of 2024, compared to the previous year, the prices of agricultural output went down by 7.1%, as in crop output they decreased by 7.6% and in animal output they fell by 5.0%.
In crop output, in the third quarter of 2024, compared to the same quarter of 2023, the most significant drop was recorded in ...
Economic accounts for agriculture for 2023 (final data)
The value of the final output produced in agriculture for 2023 amounted to 10 554.4 million BGN (at current prices), registering a decline of 18.2% compared to the previous year. The decrease was due to drop both in prices - by 15.3 and in volumes - by 3.5%, compared to 2022.
The value of the goods and services currently consumed in agriculture amounted to 6 337.4 million BGN, which was 9.3% lower than the previous year. The decrease was due to the drop both in prices - by 5.5% and in volumes - by 4.0%.
The gross value added produced in agriculture was equal to...
Price Indices in Agriculture, Second Quarter of 2024
The producer price index in agriculture for the second quarter of 2024 decreased by 3.4% in comparison with the same quarter of 2023 as a result of a decrease in the price index of crop output - by 3.8% and in the index of animal output - by 3.0%.
In the second quarter of 2024 compared to the previous year, the prices of agricultural output decreased by 4.2%, as in crop output they decreased by 4.3% and in animal output they decreased by 4.1%.
In crop output, in the second quarter of 2024, compared to the same quarter of 2023, the most significant drop was recorded in th...
Agricultural Land Prices and Rents in Agriculture in the Republic of Bulgaria in 2023
In 2023, the average price of arable land transactions in Bulgaria reached BGN 1 607 per decare, and the average price of arable land rents - BGN 62 per decare. Compared to the previous year, the price of arable land increased by 12.5%, and the rent payments decreased by 1.6%.
In 2023, compared to the previous year, there was an increase in the price of arable land transactions in Severozapaden, Severen tsentralen, Severoiztochen, Yugoiztochen and Yugozapaden regions and there was a decrease in Yuzhen tsentralen region. Compared to 2022, an increase was observed in the p...
Price Indices in Agriculture, First Quarter of 2024
The producer price index in agriculture for the first quarter of 2024 decreased by 20.5% in comparison with the same quarter of 2023 as a result of a decrease in the price index of crop output - by 27.3% and in the index of animal output - by 2.1%.
Compared to the previous year, the prices of agricultural output decreased by 8.3%, as in crop output they decreased by 11.7% and in animal output they increased by 1.0%.
In crop output, in the first quarter of 2024, compared to the same quarter of 2023, the highest drop was recorded in the prices of cereals - b...
Price Indices in Agriculture, Fourth Quarter of 2023
The producer price index in agriculture for the fourth quarter of 2023 decreased by 20.5% in comparison with the same quarter of 2022 as a result of a decrease in the price index of crop output by 25.6% and an increase in the index of animal output by 1.5%.
Compared to the previous year, the prices of agricultural output decreased by 19.1%, as in crop output they decreased by 27.4% and in animal output they increased by 16.0%.
In crop output, in the fourth quarter of 2023, compared to the same quarter of 2022, the highest drop was recorded in the prices of cereals -...
Economic Accounts for Agriculture for 2023 (First Estimate)
According to the first estimate of Economic Accounts for Agriculture, the final output of the agricultural 'industry' at basic prices in 2023 amounted to 10 445.9 million BGN. Gross value added at basic prices decreased by 30.4% on an annual basis and reached 4 118.8 million BGN, and net entrepreneurial income amounted to 1 067.3 million BGN.
...Price Indices in Agriculture, Third Quarter of 2023
The producer price index in agriculture for the third quarter of 2023 decreased by 24.9% in comparison with the same quarter of 2022 as a result of an decrease in the price index of crop output by 30.5% and an increase in the index of animal output by 10.5%.
Compared to the previous year, the prices of agricultural output decreased by 23.8%, as in crop output they decreased by 29.9% and in animal output they increased by 13.9%.
In crop output, in the third quarter of 2023, compared to the same quarter of 2022, the highest drop was recorded in the prices of cereals -...
Economic accounts for agriculture for 2022 (final data)
The value of the final output produced in agriculture for 2022 amounted to 12 901.9 million BGN (at current prices), which was 19.2% more than the previous year. The increase was due to the price growth - by 29.8%, while in volumes of production, a decrease was observed - by 8.2%.
The value of the goods and services currently consumed in agriculture amounted to 6 988.7 million BGN, which was 24.5% higher than the previous year. The increase was due to the rise in prices - by 32.6%, while volumes registered a decrease - by 6.1%.
The gross val...
Price Indices in Agriculture, Second Quarter of 2023
The producer price index in agriculture for the second quarter of 2023 decreased by 6.4% in comparison with the same quarter of 2022 as a result of a decrease in the price index of crop output by 19.5%, while the index of animal output increased by 14.8%.
Compared to the previous year, the prices of agricultural output decreased by 4.8%, as in crop output they decreased by 15.8% and in animal output they increased by 12.9%.
In crop output, in the second quarter of 2023, compared to the same quarter of 2022, the highest drop was recorded in the prices of industrial crops ...
Agricultural Land Prices and Rents in Agriculture in the Republic of Bulgaria in 2022
In 2022 the average price of arable land transactions in Bulgaria reaches BGN 1 428 per decare, and the average price of arable land rents - BGN 63 per decare. Compared to the previous year, the price of arable land increased by 21.6%, and the rent payments - by 21.2%.
Compared to the previous year, there was an increase in the price of arable land transactions and in the price paid for rent/lease of one decare in all six statistical regions of the country.
...Price Indices in Agriculture, First Quarter of 2023
The producer price index in agriculture decreased by 0.9% for the first quarter of 2023 in comparison with the same quarter of 2022 as a result of a decrease in the price index of crop output by 8.6% and an increase in the index of animal output by 36.8%.
Compared to the previous year, the prices of agricultural output decreased by 5.9%, as in crop output they decreased by 12.8% and in animal output they increased by 20.3%.
In crop output, in the first quarter of 2023, compared to the same quarter of 2022, the highest drop was recorded in the prices of industrial crops -...
Price Indices in Agriculture, Fourth Quarter of 2022
The producer price index in agriculture for the fourth quarter of 2022 increased by 18.0% compared to the same quarter of 2021 as a result of an increase in the price index of crop output by 14.7% and livestock output by 36.2%.
Compared to the previous year, the prices of agricultural output increased by 28.2%, and in crop output they increased by 25.9% and in livestock output by 41.3%.
In crop output, in the fourth quarter of 2022, compared to the same quarter of 2021, the highest growth was recorded in the prices of cereals - by 30.3%. The trend also retained in compar...
Economic Accounts for Agriculture for 2022 (First Estimation)
According to the first estimate of Economic Accounts for Agriculture, the final output of the agricultural 'industry' at basic prices in 2022 amounted to 12 903.2 million BGN. Gross value added at basic prices increased by 9.9% on an annual basis and reached 5 677.1 million BGN, and net entrepreneurial income amounted to 3 633.6 million BGN.
...Price Indices in Agriculture, Third Quarter of 2022
The producer price index in agriculture for the third quarter of 2022 increased by 45.5% compared to the same quarter of 2021, as a result of an increase in the price index of crop output by 47.7% and livestock output by 28.6%.
Compared to the previous year, the prices of agricultural output increased by 39.0%. In crop output, they increased by 40.4%, and in livestock output, they increased by 28.4%.
In crop output, in the third quarter of 2022, compared to the same quarter of 2021, the highest growth was recorded in the prices of cereals - by 63.0% and industrial c...
Economic accounts for agriculture for 2021 (final data)
The value of the final output produced in agriculture for 2021 amounted to 10 776.2 million BGN (at current prices), which was 37.0% more than the previous year. The increase was due to both the increase in volumes of production - by 18.0% and an increase of prices - by 16.1% on an annual basis.
The value of the goods and services currently consumed in agriculture in 2021 amounted to 5 612.8 million BGN, which was 26.2% higher than the previous year. The increase was due to the rise both in volumes - by 13.3%, and in prices - by 11.4% on an annual basis....
Price Indices in Agriculture, Second Quarter of 2022
The producer price index in agriculture in the second quarter of 2022 increased by 37.5% in comparison with the same quarter of 2021. The price index of crop output increased by 46.4% and the animal output increased by 26.9%. In comparison with the previous year, the prices of agricultural output went up by 34.5%, as in crop output they increased by 42.6%, and in animal output - by 24.8%.
The index of prices of goods and services currently consumed in agriculture in the second quarter of 2022 was higher by 46.2% compared to the same quarter of the...
Agricultural Land Prices and Rents in Agriculture in the Republic of Bulgaria in 2021
In 2021 the average price of arable land transactions in Bulgaria reached BGN 1 192 per decare, and the average price of arable land rents - BGN 55 per decare. Compared to the previous year, the price of arable land increased by 14.4%, and the rent payments - by 20.5%.
...Price Indices in Agriculture, First Quarter of 2022
The producer price index in agriculture in the first quarter of 2022 increased by 25.6% in comparison with the same quarter of 2021. The price index of crop output increased by 31.2% and the animal output increased by 13.2%. In comparison with the previous year, the prices of agricultural products went up by 21.4%, as in crop output they increased by 25.9%, and animal output - by 11.2%.
The index of prices of goods and services currently consumed in agriculture in the first quarter of 2022 was higher by 37.6% compared to the same quarter of the pr...
Price Indices in Agriculture, Fourth Quarter of 2021
The producer price index in agriculture in the fourth quarter of 2021 increased by 24.4% in comparison with the same quarter of 2020. The price index of crop output increased by 28.5% and the animal output increased by 5.6%. In comparison with the previous year, the prices of agricultural products went up by 31.8%, as in crop output they increased by 37.7%, and in animal output - by 4.1%.
The index of prices of goods and services currently consumed in agriculture in the fourth quarter of 2021 was higher by 26.6% compared to the same quarter of the...
Economic Accounts for Agriculture for 2021 (First Estimation)
According to the first estimate of Economic Accounts for Agriculture in 2021 the value of final output in agriculture was by 32.4% higher than in previous year. The gross value added increased by 44.7%, net operating surplus/mixed income - by 33.0% and net entrepreneurial income by 43.0%.
...Price Indices in Agriculture, Third Quarter of 2021
The producer price index in agriculture in the third quarter of 2021 increased by 19.8% in comparison with the same quarter of 2020. The price index of crop output increased by 23.2% and the animal output increased by 1.6%. In comparison with the previous year, the prices of agricultural products went up by 15.5%, as in crop output they increased by 18.2%, and in animal output the increase is by 1.4%.
The index of prices of goods and services currently consumed in agriculture in the third quarter of 2021 was higher by 14.0% compared to the same qu...
Economic accounts for agriculture for 2020 (final data)
The value of final output in agriculture in 2020 compared to the previous year decreased by 4.5%. The gross value added decreased by 1.1%, net operating surplus/mixed income - by 0.2% and net entrepreneurial income - by 2.1%.
...Price Indices in Agriculture, Second Quarter of 2021
The producer price index in agriculture in the second quarter of 2021 increased by 10.4% in comparison with the same quarter of 2020. The price index of crop output increased by 20.4% while the animal output decreased by 1.9%. In comparison with the previous year, the prices of the agricultural output went up by 8.1%. In crop output the prices increased by 17.1%, while in animal output decrease was registered - by 3.0%.
The index of prices of goods and services currently consumed in agriculture in the second quarter of 2021 was higher by 9.6% comp...
Agricultural Land Prices and Rents in Agriculture in the Republic of Bulgaria in 2020
In 2020 the average price of arable land transactions in Bulgaria reaches BGN 1 042 per decare, and the average price of arable land rents - BGN 46 per decare. Compared to the previous year, the price of arable land decreased by 1.0%, and the rent payments - by 6.1%.
...Price Indices in Agriculture, First Quarter of 2021
The producer price index in agriculture in the first quarter of 2021 increased by 18.6% in comparison with the same quarter of 2020. The price index of crop output increased by 28.9% while the animal output decreased by 3.7%. In comparison with the previous year, the prices of agricultural output went up by 16.8%, as in crop output they increased by 24.8%, and in animal output a slight decrease of 0.6% was registered.
The index of prices of goods and services currently consumed in agriculture in the first quarter of 2021 was higher by 1....
Price Indices in Agriculture, Fourth Quarter of 2020
The producer price index in agriculture in the fourth quarter of 2020 increased by 15.8% in comparison with the same quarter of 2019. The crop output index increased by 19.9%, while the animal output index decreased by 5.3%. In comparison with previous year, the prices of agricultural output went up by 17.5% as result of the increase in crop output price index was by 20.9% and the animal output price index decreased by 0.4%.
The index of prices of goods and services currently consumed in agriculture in the fourth quarter of 2020 was by 4...
Economic Accounts for Agriculture for 2020 (First Estimation)
According to the first estimate of Economic Accounts for Agriculture in 2020 the value of final output in agriculture was by 8.3% lower than in previous year. The gross value added decreased by 11.5%, net operating surplus/mixed income - by 6.4% and net entrepreneurial income by 6.3%.
...Price Indices in Agriculture, Third Quarter of 2020
The producer price index in agriculture in the third quarter of 2020 increased by 6.8% in comparison with the same quarter of 2019. The crop output index increased by 7.6% and the animal output index increased by 1.7%. In comparison with previous year, the prices of agricultural output went up by 4.2% as the increase in crop output price index was by 4.9%, while the animal output price index remained almost unchanged - a minimal increase of 0.1% was registered.
The index of prices of goods and services currently consumed in agriculture i...
Economic accounts for agriculture for 2019 (preliminary data)
The value of final output in agriculture in 2019 (preliminary data) compared to the previous year went up by 0.5%. The gross value added increased by 1.7%, net operating surplus/mixed income - by 3.7% and net entrepreneurial income by 4.3%.
...Price Indices in Agriculture, Second Quarter of 2020
The producer price index in agriculture in the second quarter of 2020 increased by 2.8% in comparison with the same quarter of 2019. The crop output index increased by 3.7% and in animal output - by 1.6%. Compared to previous year, the prices of agricultural output went up by 4.3% as the increase in crop output prices was by 7.5%, while the prices of animal output remained almost unchanged.
The index of prices of goods and services currently consumed in agriculture in the second quarter of 2020 was by 5.3% lower compared to the same quarter of pre...
Agricultural Land Prices and Rents in Agriculture in the Republic of Bulgaria in 2019
The average price per one decar arable land in 2019 in Bulgaria reached BGN 1053 and per one decar hired/leased arable land - BGN 49. In comparison to the previous year in the price of land transactions increase by 7.4% was reported, while the price of rental payments was lower by 2%.
...Price Indices in Agriculture, First Quarter of 2020
The producer price index in agriculture in the first quarter of 2020 increased by 6.0% in comparison with the same quarter of 2019. The crop output index increased by 5.9% and the animal output index increased by 6.3%. In comparison with previous year, the prices of agricultural output went up by 7.7% as the increase in crop output price index was by 9.4% and in animal output price index increase was by 4.4%.
The index of prices of goods and services currently consumed in agriculture in the first quarter of 2020 was by 2.4% higher compared to the same...
Price Indices in Agriculture, Fourth Quarter of 2019
The producer price index in agriculture in the fourth quarter of 2019 increased by 2.8% in comparison with the same quarter of 2018. The crop output index increased by 0.9% and the animal output index increased by 12.6%. In comparison with previous year, the prices of agricultural output went up by 1.6% as the decrease in crop output price index is by 0.4% and in animal output price index increase is by 11.7%.
The index of prices of goods and services currently consumed in agriculture in the fourth quarter of 2019 was by 1.4% higher compared to the sa...
Price Indices in Agriculture, Third Quarter of 2019
The producer price index in agriculture in the third quarter of 2019 decreased by 4.6% in comparison with the same quarter of 2018. The crop output index decreased by 6.0% and the animal output index increased by 3.7%. In comparison with previous year, the prices of agricultural output went down by 2.0% as the decrease in crop output price index is by 3.4% and in animal output price index increase is by 2.8%.
The index of prices of goods and services currently consumed in agriculture in the third quarter of 2019 was by 0.9% higher compared to the same...
Economic Accounts for Agriculture for 2018 (Preliminary Data)
Despite the observed increase in the value of final output in agriculture by 2.7%, the income of agricultural holdings in 2018 decreased compared to the previous year. Gross value added decreased by 2.5%, net operating surplus / mixed income by 5.4% and net entrepreneurial income by 8.7%.
...Price Indices in Agriculture, Second Quarter of 2019
The producer price index in agriculture in the second quarter of 2019 increased by 5.3% in comparison with the same quarter of 2018. The crop output index increased by 5.8%, as well as the animal output index - by 4.6%. In comparison with previous year the prices of agricultural output went up by 4.1% due to the increase in crop output price index - by 4.9% and in animal output price index - by 3.0%.
The index of prices of goods and services currently consumed in agriculture in the second quarter of 2019 was by 3.1% higher compared to the same quarter...
Agricultural Land Prices and Rents in Agriculture in the Republic of Bulgaria in 2018
The average price per one decar agricultural land reached BGN 941 in 2018, which was 7.9% higher than in 2017. The average rent price per one decar hired/leased agricultural land reached BGN 48 and was 4.3% higher than in 2017.
...Price Indices in Agriculture, First Quarter of 2019
The producer price index in agriculture in the first quarter of 2019 increased by 5.4% in comparison with the same quarter of 2018. The crop output index increased by 7.1%, as well the animal output index - by 2.0%. In comparison with previous year the prices of agricultural output went up by 5.3% due to the increase in crop output price index - by 5.8% and in animal output price index - by 4.2%.
The index of prices of goods and services currently consumed in agriculture in the first quarter of 2019 was by 1.8% higher compared to the same quarter of p...
Price Indices in Agriculture, Fourth Quarter of 2018
The producer price index in agriculture in the fourth quarter of 2018 increased by 2.9% in comparison with the same quarter of 2017. The crop output index increased by 4.5%, while the prices of animal output went down - by 4.0%. In comparison with previous year the prices of agricultural output went down by 1.8% as result of the drop down of the prices in crop output - by 1.4% and in animal output - by 3.3%
The index of prices of goods and services currently consumed in agriculture in the fourth quarter of 2018 increased by 3.6% compared to the same q...
Economic Accounts for Agriculture for 2018 (First Estimation)
According to the first estimate of Economic Accounts for Agriculture the final output at basic prices in 2018 amounted to 8 077.2 million BGN, which was by 2% lower than in previous year. The decrease was mainly due to drop in the volumes - by 3.1%.
Gross value added at basic prices produced in agriculture in 2018 was estimated at 3 404.7 million BGN and was by 9.5% lower than in 2017. The decrease was due to fall in the prices - by 1.2%, and in the volumes - by 8.4%.
...Price Indices in Agriculture, Third Quarter of 2018
The producer price index in agriculture in the third quarter of 2018 increased by 6.6% in comparison with the same quarter of 2017. The crop output index increased by 7.7%, as well as the animal output index - by 0.1%. In comparison with previous year the prices of agricultural output went up by 1.7% due to the increase in crop output price index - by 2.7% and decrease in animal output price index - by 3.7%.
The index of prices of goods and services currently consumed in agriculture in the third quarter of 2018 was by 4.0% higher compared to the same ...
Price Indices in Agriculture, Second Quarter of 2018
The producer price index in agriculture in the second quarter of 2018 decreased by 5.8% in comparison with the same quarter of 2017. The crop output index decreased by 8.5%, as well as the animal output index - by 2.3%. In comparison with previous year the prices of agricultural output went down by 2.9% due to the decrease in crop output price index - by 1.9% and in animal output price index - by 4.2%.
The index of prices of goods and services currently consumed in agriculture in the second quarter of 2018 was by 1.9% higher compared to the same quart...
Price Indices in Agriculture, First Quarter of 2018
The producer price index in agriculture in the first quarter of 2018 decreased by 7.4% in comparison with the same quarter of 2017. The crop output index decreased by 11.2%, as well the animal output index - by 1.2%. In comparison with previous year the prices of agricultural output went down by 1.5% due to the decrease in crop output price index - by 3.1% and increase in animal output price index - by 1.2%.
The index of prices of goods and services currently consumed in agriculture in the first quarter of 2018 was by 0.6% higher compared to the same ...
Agricultural Land Prices and Rents in Agriculture in the Republic of Bulgaria in 2017
The average price per one decar agricultural land reached BGN 872 in 2017, which was 14.6% higher than in 2016. The average rent price per one decar hired/leased agricultural land reached BGN 46 and was 4.5% higher than in 2016.
...Price Indices in Agriculture, Fourth Quarter of 2017
The producer price index in agriculture in the fourth quarter of 2017 decreased by 4.7% in comparison with the same quarter of 2016. The crop output index decreased by 7.5%, while the prices of animal output went up - by 8.9%. In comparison with previous year the prices of agricultural output went down by 5.1% as result of the drop down of the prices in crop output - by 8.4% and rise up in animal output - by 7.5%
The index of prices of goods and services currently consumed in agriculture in the fourth quarter of 2017 increased by 2.0% compared to the ...
Economic Accounts for Agriculture for 2017 (First Estimation)
According to the first estimate of Economic Accounts for Agriculture the final output at basic prices in 2017 amounted to 7 700.1 million BGN, which was by 1.7% lower than in previous year. Gross value added at basic prices produced in agriculture in 2017 was estimated at 3 371.3 million BGN and was by 3% lower than in 2016, and the value of net entrepreneurial income - 2 270.3 million BGN, and decreased by 0.9% compared to last year.
...Price Indices in Agriculture, Third Quarter of 2017
The producer price index in agriculture in the third quarter of 2017 increased by 3.6% in comparison with the same quarter of 2016. The crop output index increased by 2.3%, as well as the animal output index - by 10.9%. In comparison with previous year the prices of agricultural output went down by 1.9%. The crop output decreased by 1.9%, while in animal output an increase was observed by 6.8%.
The index of prices of goods and services currently consumed in agriculture in the third quarter of 2017 remained almost unchanged - 0.1% above the level in th...
Price Indices in Agriculture, Second Quarter of 2017
The producer price index in agriculture in the second quarter of 2017 increased by 2.0% in comparison with the same quarter of 2016. The crop output index decreased by 0.8%, while the animal output index increased by 6.3%. In comparison with previous year the prices of agricultural output went up by 4.5% due to the increase in crop output price index - by 3.9% and in animal output price index - by 5.3%.
The index of prices of goods and services currently consumed in agriculture in the second quarter of 2017 was 2.0% above the level in the same quarter...
Price Indices in Agriculture, First Quarter of 2017
The producer price index in agriculture in the first quarter of 2017 increased by 4.7% in comparison with the same quarter of 2016. The crop output index increased by 6.7%, as well the animal output index - by 1.8%. In comparison with previous year the prices of agricultural output went up by 6.8% due to the increase in crop output price index - by 7.8% and in animal output price index - by 5.2%.
The index of prices of goods and services currently consumed in agriculture in the first quarter of 2017 was 1.4% above the level in the same quarter of prev...
Agricultural Land Prices and Rents in Agriculture in the Republic of Bulgaria in 2016
The average price per one decar agricultural land reached BGN 761 in 2016, which was 4.0% higher than in 2015. The average rent price per one decar hired/leased agricultural land in 2016 reached BGN 44 and was 4.8% higher than in 2015.
...Price Indices in Agriculture, Fourth Quarter of 2016
The producer price index in agriculture in the fourth quarter of 2016 decreased by 5.1% in comparison with the same quarter of 2015. The crop output index decreased by 4.2%, as well the animal output index - by 11.2%. In comparison with previous year the prices of agricultural output went down by 3.3% due to the fall in crop output price index - by 2.6% and in animal output price index - by 7.3%.
The index of prices of goods and services currently consumed in agriculture in the fourth quarter of 2016 was 1.2% below the level in the same quarter of pre...
Statistical Yearbook 2024
The National Statistical Institute (NSI) has the pleasure to present to the attention of national and foreign users of statistical information the 92nd edition of the ‘Statistical Yearbook of the Republic of Bulgaria’ in electronic format.
It provides current statistical information about the demographic, economic and social development of the country for 2018 - 2023 in different territorial and classification aggregations and breakdowns.
According to the Law on Statistics, the official source of information in the Republic of Bulgaria is the National Statistic...
Statistical Yearbook 2023
The National Statistical Institute (NSI) has the pleasure to present to the attention of national and foreign users of statistical information the 91-st edition of the ‘Statistical Yearbook of the Republic of Bulgaria’ in printed format.
It provides current statistical information about the demographic, economic and social development of the country for 2017 - 2022 in different territorial and classification aggregations and breakdowns.
According to the Law on Statistics, official source of information in the Republic of Bulgaria is the National Statistical Sys...
Statistical Yearbook 2022
The National Statistical Institute (NSI) has the pleasure to present to the attention of national and foreign users of statistical information the 90th edition of the ‘Statistical Yearbook of the Republic of Bulgaria’ in printed format.
It provides current statistical information about the demographic, economic and social development of the country for 2016 - 2021 in different territorial and classification aggregations and breakdowns.
According to the Law on Statistics, official source of information in the Republic of Bulgaria is the National Statistical ...
Statistical Yearbook 2021
The National Statistical Institute (NSI) has the pleasure to present to the attention of national and foreign users of statistical information the 89th edition of the ‘Statistical Yearbook of the Republic of Bulgaria’ in printed and electronic format.
It provides current statistical information about the demographic, economic and social development of the country for 2015 - 2020 in different territorial and classification aggregations and breakdowns.
According to the Law on Statistics, official source of information in the Republic of Bulgaria is the ...
Statistical Yearbook 2020
The National Statistical Institute (NSI) has the pleasure to present to the attention of national and foreign users of statistical information the 88th edition of the ‘Statistical Yearbook of the Republic of Bulgaria’ in printed and electronic format.
It provides current statistical information about the demographic, economic and social development of the country for 2014 - 2019 in different territorial and classification aggregations and breakdowns.
According to the Law on Statistics, official source of information in the Republic of Bulgaria is the ...
Statistical Yearbook 2012
The National Statistical Institute (NSI) has the pleasure to submit to the attention of national and foreign users of statistical information the 80th edition of the ‘Statistical Yearbook of the Republic of Bulgaria’ in printed and electronic format.
It provides current statistical information about the demographic, economic and social development of the country for the 2007 - 2011 period in different territorial and classification aggregations and breakdowns.
Accor...
Statistical Yearbook 2019
The National Statistical Institute (NSI) has the pleasure to present to the attention of national and foreign users of statistical information the 87th edition of the ‘Statistical Yearbook of the Republic of Bulgaria’ in printed and electronic format.
It provides current statistical information about the demographic, economic and social development of the country for 2013 - 2018 in different territorial and classification aggregations and breakdowns.
According to the Law on Statistics, official source of information in the Republic of Bulgaria is the ...
Statistical Yearbook 2018 in infographics
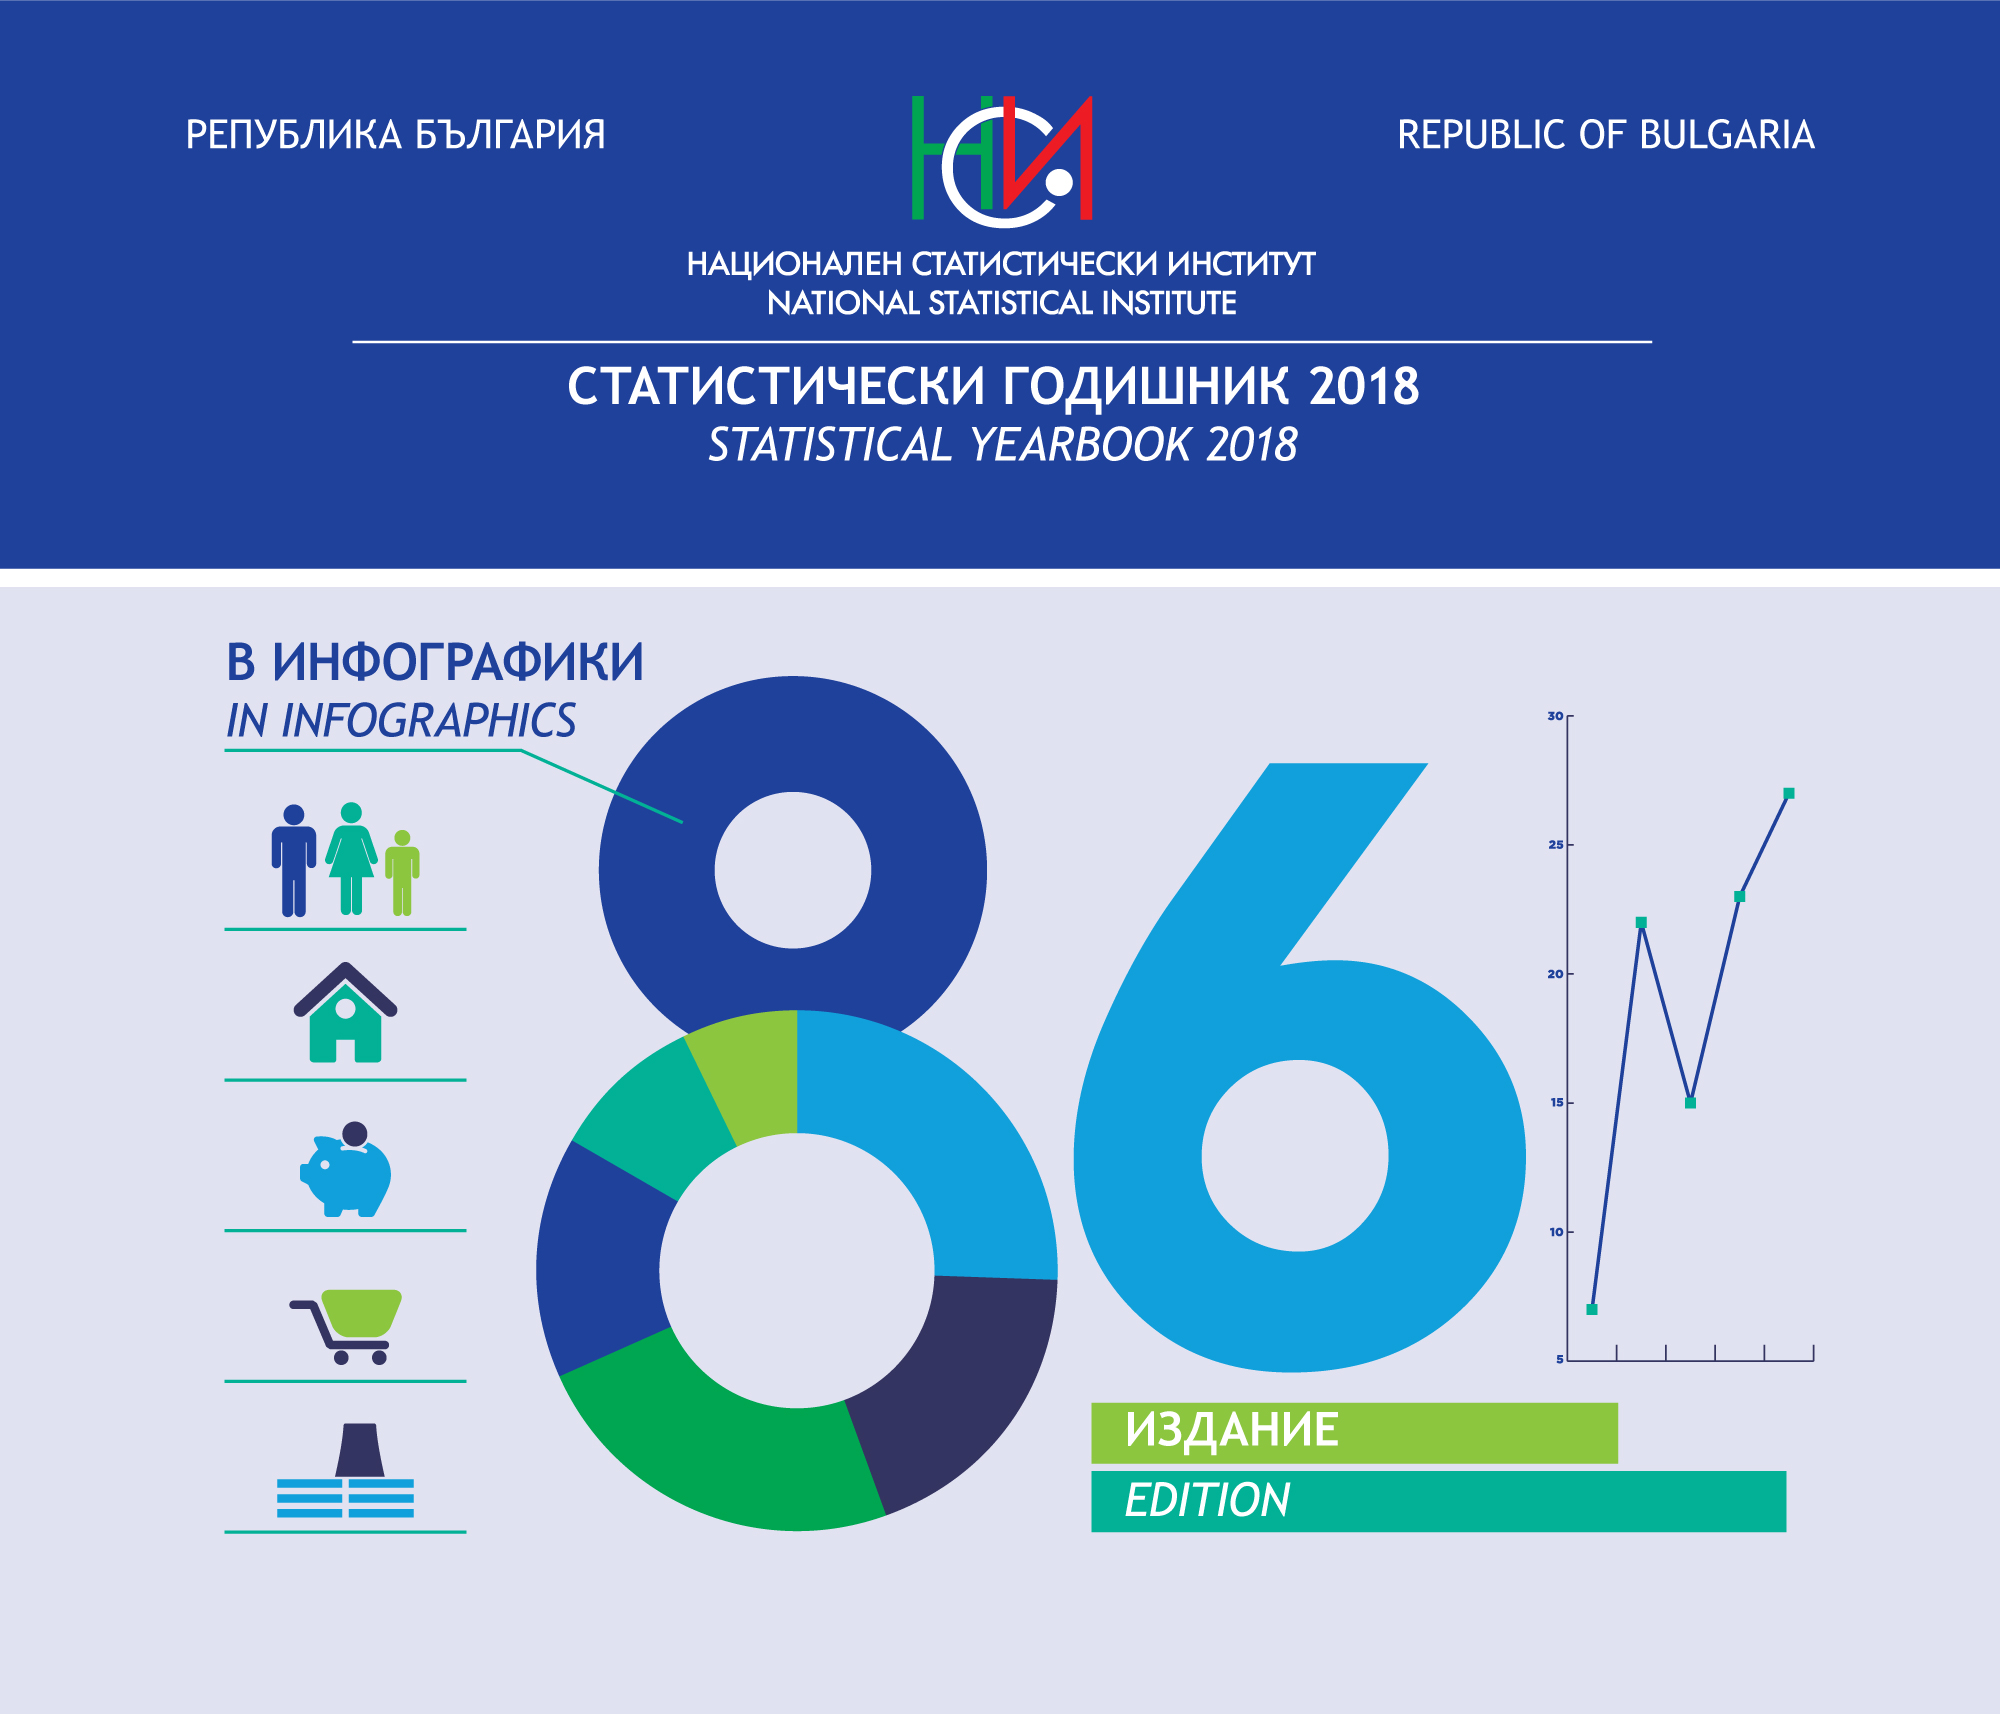
The National Statistical Institute presents to your attention the 86th edition of the Statistical Yearbook of the Republic of Bulgaria in infographics.
In 2018, for the first time, we presented the results of the statistical surveys through graphics, images and other visualization tools, which resulted in a positive response among a wide range of users. We believe that this modern way of presenting statistical information will trigger the interest in those who for the first time encounter the meaning of numbers revealing important aspects of socio-economic life.
...Statistical Yearbook 2018

The National Statistical Institute (NSI) has the pleasure to present to the attention of national and foreign users of statistical information the 86th edition of the ‘Statistical Yearbook of the Republic of Bulgaria’ in printed and electronic format.
It provides current statistical information about the demographic, economic and social development of the country for 2012 - 2017 in different territorial and classification aggregations and breakdowns.
According to the Law on Statistics, official source of information in the Republic of Bulgaria is the ...
Statistical Yearbook 2017 in infographics

The National Statistical Institute of Bulgaria offers a different view of the statistical information included in the 85th edition of the Statistical Yearbook of the Republic of Bulgaria.
The publication is intended for a wider audience as statistical data are presented in a plain and easy understandable way.
The current state and changes in the socio-economic and cultural life in the country are presented not in the traditional way in tables and text, but through infographics - images, graphics and other visualization tools.
We belie...
Statistical Yearbook 2017
The National Statistical Institute (NSI) has the pleasure to present to the attention of national and foreign users of statistical information the 84th edition of the ‘Statistical Yearbook of the Republic of Bulgaria’ in printed and electronic format.
It provides current statistical information about the demographic, economic and social development of the country for 2012 - 2016 in different territorial and classification aggregations and breakdowns.
According to the Law on Statistics, official source of information in the Republic of Bulgaria is the ...
Statistical Yearbook 2016

The National Statistical Institute (NSI) has the pleasure to present to the attention of national and foreign users of statistical information the 84th edition of the ‘Statistical Yearbook of the Republic of Bulgaria’ in printed and electronic format.
It provides current statistical information about the demographic, economic and social development of the country for 2011 - 2015 in different territorial and classification aggregations and breakdowns.
According to the Law on Statistics, official source of information in the Republic of Bulgaria is the ...
Statistical Yearbook 2015
The National Statistical Institute (NSI) has the pleasure to present to the attention of national and foreign users of statistical information the 83rd edition of the ‘Statistical Yearbook of the Republic of Bulgaria’ in printed and electronic format.
It provides current statistical information about the demographic, economic and social development of the country for 2010 - 2014 in different territorial and classification aggregations and breakdowns.
According to the Law on Statistics, official source of information in the Republic of Bulgaria is the ...
Statistical Yearbook 2014
The National Statistical Institute (NSI) has the pleasure to present to the attention of national and foreign users of statistical information the 82nd edition of the ‘Statistical Yearbook of the Republic of Bulgaria’ in printed and electronic format.
It provides current statistical information about the demographic, economic and social development of the country for 2009 - 2013 in different territorial and classification aggregations and breakdowns.
According to the Law on Statistics, official source of information in the Republic of Bulgaria is the Nati...
Statistical Yearbook 2013

The National Statistical Institute (NSI) has the pleasure to present to the attention of national and foreign users of statistical information the 81st edition of the ‘Statistical Yearbook of the Republic of Bulgaria’ in printed and electronic format.
It provides current statistical information about the demographic, economic and social development of the country for 2008 - 2012 in different territorial and classification aggregations and breakdowns.
According to the Law on Statistics, official source of information in the Republic of Bulgaria is the Nati...
Land Market and Rents in Agriculture in the Republic of Bulgaria during the period 2010-2012
The National Statistical Institute presents to the users of statistical data the issue ‘Land market and rents in agriculture in the Republic of Bulgaria during the period 2010-2012’ on paper and electronic format. The issue is bilingual (Bulgarian/English).
The issue was prepared within the Grant agreement project between the European Commission (Eurostat) and the National Statistical Institute of the Republic of Bulgaria on ‘Agricultural land prices and rents data collection system following the common target methodology’. The data were collected within the stati...
Statistical Yearbook 2011
The National Statistical Institute (NSI) has the pleasure to submit to the attention of national and foreign users of statistical information the 79th edition of the ‘Statistical Yearbook of the Republic of Bulgaria’ in printed and electronic format.
It provides current statistical information about the demographic, economic and social development of the country for the 2005 - 2010 period in different territorial and classification aggregations and breakdowns.
According ...
Statistical Yearbook 2010
The National Statistical Institute (NSI) has the pleasure to submit to the attention of national and foreign users of statistical information the 78th edition of the ‘Statistical Yearbook of the Republic of Bulgaria’ in printed and electronic format.
It provides current statistical information about the demographic, economic and social development of the country for the 2004 - 2009 period in different territorial and classification aggregations and breakdowns.
Accor...
Statistical Yearbook 2009
The National Statistical Institute (NSI) has the pleasure to submit to the attention of national and foreign users of statistical information the 77th edition of the ‘Statistical Yearbook of the Republic of Bulgaria’ in printed and electronic format. The issue is published in 2010, which marks 130 years since the establishment of a statistical institution in Bulgaria and 100 years since publishing of the first ‘Statistical Yearbook of the Bulgarian Kingdom’ in 1910.
This issue has new design and layout. It provides current statistical information about ...
Statistical Yearbook 2008
The National Statistical Institute has the pleasure to submit to the attention of national and foreign users of statistical information the 76th edition of the Statistical Yearbook of the Republic of Bulgaria 2008. It provides topical statistical information on the demographic, economic and social development of the country for the 2002 - 2007 period in different territorial and classification aggregations and breakdowns.
According to the Law on Statistics, official source of information in the Republic of Bulgaria is the National Statistical System, wh...
Statistical Reference Book of the Republic of Bulgaria 2008
The National Statistical Institute presents to users of statistical information one of its main publications - Statistical Reference Book of the Republic of Bulgaria 2008 in English. It is a concise form of the same issue in Bulgarian.
The Statistical Reference Book presents topical information on the demographic processes as well as the economic, social and cultural development of the Republic of Bulgaria for the 2004 - 2007 period.
The publication presents data on main macroeconomic indicators of the national economy - gross dom...


