Capacity, performances and attendances - total and of which of the tours in the music and dance formations by form of ownership
Time series : Culture_7.7_en.xls
| Music and dance formations | Capacity - number | Theatre performances - number | Theatre attendances - number | |||||
|---|---|---|---|---|---|---|---|---|
| Total | Of which: of the tours | Total | Of which: of the tours | |||||
| in country | in abroad | in country | in abroad | |||||
| Total | 66 | 26 533 | 1 729 | 862 | 41 | 540 372 | 328 555 | 28 800 |
| States | 18 | 6 794 | 789 | 292 | 18 | 232 475 | 108 701 | 4 000 |
| Municipals | 38 | 19 239 | 823 | 468 | 15 | 251 306 | 183 063 | 9 800 |
| Privates | 10 | 500 | 117 | 102 | 8 | 56 591 | 36 791 | 15 000 |
23.05.2025
Euro-SDMX Metadata Structure (ESMS)
| Contact | |
|---|---|
| Contact organisation | National Statistical Institute |
| Contact organisation unit | Education and Culture Statistics Department |
| Contact name | Nikolay Nikolov |
| Contact person function | Chief Expert |
| Contact mail address | 2, P. Volov Str.; 1038 Sofia, Bulgaria |
| Contact email address | NSNikolov@nsi.bg |
| Contact phone number | + 359 2 9857 487 |
| Contact fax number | |
| Metadata update | |
| Metadata last certified | 23 May 2025 |
| Metadata last posted | 23 May 2025 |
| Metadata last update | 23 May 2025 |
| Statistical presentation | |
| Data description | Data refers to the number of theaters and music and dance formations. Survey includes indicators for the number of seating capacity, performances, theatre attendance and revenue - total and subsidies from the state and local budget, tickets, donations and from sponsors. Data like average number of performances per theatre, average number of attendances per a theater and per one performance are also presented. The activity of the National Agency Music, companies and associations organizing recitals and concerts is included with two indicators - number and visitors. |
| Classification system | · Nomenclature of territorial units for statistical purposes in Bulgaria (NUTS). |
| Sector coverage | Theaters, operas, operettas, music and dance formations - philharmonics, ensembles for folk songs and dances and orchestras, activity of the National Agency Music and organized events by companies and associations. |
| Statistical concepts and definitions | Cultural institutions, according to the Regulation for the acquisition and deprivation of status of state cultural institution with national importance, are with subject of activity: creation and presentation in front of an audience of music, dance and theatrical performances; storage of the elements of national identity - language, traditions and cultural heritage; encourage the spirit of tolerance and dialogue between different cultures. |
| Statistical unit | Units of observation are theaters, operas, operettas, circuses, music and dance formations, companies and associations which are organized and held recitals and concerts (pop music, folk, symphonic, chamber, choral, brass bands, mixed and others). |
| Statistical population | The target population is all theaters, music and dance formations and companies and associations which are organized and held recitals and concerts. |
| Reference area | The whole country.
|
| Time coverage | From 2000. |
| Base period | Not applicable. |
| Unit of measure | |
Number, Thousand BGN | |
| Reference period | |
Yearly. | |
| Institutional mandate | |
| Legal acts and other agreements | · Law on Statistics; · Regulations for the acquisition and deprivation of status of state cultural institution with national importance; · Regulations № - N 6 of 29 June 2007 for the organization of creative activity in the state institute of culture, in the state cultural institution with national importance Section II. Organizing and reporting the creation activity of the state cultural institutes in the field of the theater, music and dance. |
| Data sharing | There is an agreement to exchange data with Ministry of Culture. |
| Confidentiality | |
| Confidentiality - policy | · Law on Statistics; · Regulation (EC) No 223/2009 on European statistics (recital 24 and Article 20(4)) of 11 March 2009 (OJ L 87, p. 164), stipulates the need to establish common principles and guidelines ensuring the confidentiality of data used for the production of European statistics and the access to those confidential data with due account for technical developments and the requirements of users in a democratic society. |
| Confidentiality - data treatment | Individual data are not published in accordance with article 25 of the Law on Statistics. The publishing of individual data can be performed only in accordance with article 26 of the same law Individual data are not published in accordance with article 25 of the Law on Statistics. The publishing of individual data can be performed only in accordance with article 26 of the same law. |
| Release policy | |
| Release calendar | The date for publication of statistical |
| Release calendar access | The calendar is available on the NSI website: https://old.nsi.bg/en/node/480 |
| User access | Data is published on the NSI website, section Culture in accordance with the Law on Statistics and the European Statistics Code of Practice respecting the professional independence and aimed at objectivity, transparency and equal treatment of all consumers. |
| Frequency of dissemination | |
Annual. | |
| Accessibility and clarity | |
| News release | Regular press release. |
| Publications | · Statistical Yearbook; · Statistical Reference Book; · 'Bulgaria' (brochure); · Regions, districts and municipalities in the Republic of Bulgaria. |
| On-line database | Data on performing arts are available to all users of the NSI website under the heading Culture - Performing arts: https://old.nsi.bg/en/node/4639 and Informational System Infostat: https://infostat.nsi.bg/infostat/pages/module.jsf?x_2=180 |
| Micro-data access | Anonymised individual data can be provided for scientific and research purposes, upon request according to the Rules for the provision of anonymised individual data for scientific and research purposes. |
| Other | Information service on request, according to the Rules for the dissemination of statistical products and services to NSI. |
| Documentation on methodology | Survey Methodology: https://old.nsi.bg/sites/default/files/files/metadata/Culture_7_Methodology_en.pdf |
| Quality documentation | Quality documents are under preparation. |
| Quality management | |
| Quality assurance | Not applicable. |
| Quality assessment | Not applicable. |
| Relevance | |
| User needs | The main users of statistical · Ministry of Culture; · Users (including media) interested in the performing arts in the Republic of Bulgaria. |
| User satisfaction | Not applicable. |
| Completeness | High degree of completeness is ensured according to the methodology. |
| Accuracy and reliability | |
| Overall accuracy | NSI conducts an annual exhaustive survey which characterized the performing arts. There have been several preliminary estimates for incomplete or missing data, using final methods when it is possible. |
| Sampling error | Not applicable. |
| Non-sampling error | Not applicable. |
| Timeliness and punctuality | |
| Timeliness | The data for performing arts are available in the form of tables 5 months after the end of the data collection. |
| Punctuality | The terms of the previous position are strictly observed. |
| Coherence and comparability | |
| Comparability - geographical | Not applicable. |
| Comparability - over time | The data are comparable. |
| Coherence - cross domain | Not applicable. |
| Coherence - internal | Not applicable. |
| Cost and burden | |
The average duration for filling the statistical report by the respondents is about 40 minutes. | |
| Data revision | |
| Data revision - policy | Not applicable (preliminary data not published). |
| Data revision - practice | Not applicable (preliminary data not published). |
| Statistical processing | |
| Source data | Theaters, operas, operettas, circus, music and dance formations (philharmonics, ensembles for folk songs and dances, orchestras) as well as companies and associations which organize performing events. |
| Frequency of data collection | Yearly. |
| Data collection | Data are collected via statistical questionnaire "Survey on the activities of theaters, operas, operettas, circus and musical formations". Respondents send the questionnaire by e-mail. |
| Data validation | In the head office of the NSI is being done: · The logical control of data when entering; · The logical control of micro data; · The logical control of aggregate data. |
| Data compilation | Data processing is performed with Microsoft Access. |
| Adjustment | Not applicable. |
| Comment | |
Download in SDMX 2.1 file format: PERFORMING ARTS - theaters, music and dance formations, recitals and concerts
Metadata Structure Definition in SDMX 2.1: ESMS_MSD+BNSI+2.0+SDMX.2.1.xml
Download in SDMX 2.0 file format: PERFORMING ARTS - theaters, music and dance formations, recitals and concerts
Metadata Structure Definition in SDMX 2.0: ESMS_MSD+BNSI+2.0+SDMX.2.0.xml
ESS Standard for Quality Reports Structure (ESQRS)
| Contact | |
|---|---|
| Contact organisation | National Statistical Institute |
| Contact organisation unit | Education and Culture Statistics Department |
| Contact name | Nikolay Nikolov |
| Contact person function | Chief Expert |
| Contact mail address | 2, P. Volov Str.; 1038 Sofia, Bulgaria |
| Contact email address | NSNikolov@nsi.bg |
| Contact phone number | + 359 2 9857 487 |
| Contact fax number | |
| Statistical presentation | |
| Data description | Data refers to the number of theaters and music and dance formations. Survey includes indicators for the number of seating capacity, performances, theatre attendance and revenue - total and subsidies from the state and local budget, tickets, donations and from sponsors. Data like average number of performances per theatre, average number of attendances per a theater and per one performance are also presented. The activity of the National Agency Music, companies and associations organizing recitals and concerts is included with two indicators - number and visitors. |
| Classification system | · Nomenclature of territorial units for statistical purposes in Bulgaria (NUTS). |
| Sector coverage | Theaters, operas, operettas, music and dance formations - philharmonics, ensembles for folk songs and dances and orchestras, activity of the National Agency Music and organized events by companies and associations. |
| Statistical concepts and definitions | Cultural institutions, according to the Regulation for the acquisition and deprivation of status of state cultural institution with national importance, are with subject of activity: creation and presentation in front of an audience of music, dance and theatrical performances; storage of the elements of national identity - language, traditions and cultural heritage; encourage the spirit of tolerance and dialogue between different cultures. |
| Statistical unit | Units of observation are theaters, operas, operettas, circuses, music and dance formations, companies and associations which are organized and held recitals and concerts (pop music, folk, symphonic, chamber, choral, brass bands, mixed and others). |
| Statistical population | The target population is all theaters, music and dance formations and companies and associations which are organized and held recitals and concerts. |
| Reference area | The whole country.
|
| Time coverage | From 2000. |
| Base period | Not applicable. |
| Statistical processing | |
| Source data | Theaters, operas, operettas, circus, music and dance formations (philharmonics, ensembles for folk songs and dances, orchestras) as well as companies and associations which organize performing events. |
| Frequency of data collection | Yearly. |
| Data collection | Data are collected via statistical questionnaire "Survey on the activities of theaters, operas, operettas, circus and musical formations". Respondents send the questionnaire by e-mail. |
| Data validation | In the head office of the NSI is being done: · The logical control of data when entering; · The logical control of micro data; · The logical control of aggregate data. |
| Data compilation | Data processing is performed with Microsoft Access. |
| Adjustment | Not applicable. |
| Quality management | |
| Quality assurance | Not applicable. |
| Quality assessment | Not applicable. |
| Relevance | |
| User needs | The main users of statistical · Ministry of Culture; · Users (including media) interested in the performing arts in the Republic of Bulgaria. |
| User satisfaction | Not applicable. |
| Completeness | High degree of completeness is ensured according to the methodology. |
| Data completeness - rate | Not applicable (census). |
| Accuracy and reliability | |
| Overall accuracy | NSI conducts an annual exhaustive survey which characterized the performing arts. There have been several preliminary estimates for incomplete or missing data, using final methods when it is possible. |
| Sampling error | Not applicable. |
| Sampling errors - indicators | Not applicable (census). |
| Non-sampling error | Not applicable. |
| Coverage error | Not applicable (census). |
| Over-coverage - rate | Not applicable (census). |
| Common units - proportion | Not applicable (census). |
| Measurement error | Not applicable (census). |
| Non response error | Not applicable (census). |
| Unit non-response - rate | Not applicable (census). |
| Item non-response - rate | Not applicable (census). |
| Processing error | Not applicable (census). |
| Imputation - rate | Not applicable (no imputations). |
| Model assumption error | Not applicable (census). |
| Seasonal adjustment | Not applicable (no seasonal adjustments). |
| Data revision - policy | Not applicable (preliminary data not published). |
| Data revision - practice | Not applicable (preliminary data not published). |
| Data revision - average size | Not applicable (only final data is published). |
| Timeliness and punctuality | |
| Timeliness | The data for performing arts are available in the form of tables 5 months after the end of the data collection. |
| Time lag - first results | 18 weeks. |
| Time lag - final results | Not applicable (only final results published). |
| Punctuality | The terms of the previous position are strictly observed. |
| Punctuality - delivery and publication | Not applicable (data published on exact date). |
| Coherence and comparability | |
| Comparability - geographical | Not applicable. |
| Asymmetry for mirror flows statistics - coefficient | Not applicable (no flows). |
| Comparability - over time | The data are comparable. |
| Length of comparable time series | From 2000. |
| Coherence - cross domain | Not applicable. |
| Coherence - sub annual and annual statistics | Not applicable (annual survey). |
| Coherence - National Accounts | Not applicable. |
| Coherence - internal | Not applicable. |
| Accessibility and clarity | |
| News release | Regular press release. |
| Publications | · Statistical Yearbook; · Statistical Reference Book; · 'Bulgaria' (brochure); · Regions, districts and municipalities in the Republic of Bulgaria. |
| On-line database | Data on performing arts are available to all users of the NSI website under the heading Culture - Performing arts: https://old.nsi.bg/en/node/4639 and Informational System Infostat: https://infostat.nsi.bg/infostat/pages/module.jsf?x_2=180 |
| Data tables - consultations | Not available. |
| Micro-data access | Anonymised individual data can be provided for scientific and research purposes, upon request according to the Rules for the provision of anonymised individual data for scientific and research purposes. |
| Other | Information service on request, according to the Rules for the dissemination of statistical products and services to NSI. |
| Metadata - consultations | Not available. |
| Documentation on methodology | Survey Methodology: https://old.nsi.bg/sites/default/files/files/metadata/Culture_7_Methodology_en.pdf |
| Metadata completeness – rate | 100%. |
| Quality documentation | Quality documents are under preparation. |
| Cost and burden | |
The average duration for filling the statistical report by the respondents is about 40 minutes. | |
| Confidentiality | |
| Confidentiality - policy | · Law on Statistics; · Regulation (EC) No 223/2009 on European statistics (recital 24 and Article 20(4)) of 11 March 2009 (OJ L 87, p. 164), stipulates the need to establish common principles and guidelines ensuring the confidentiality of data used for the production of European statistics and the access to those confidential data with due account for technical developments and the requirements of users in a democratic society. |
| Confidentiality – data treatment | Individual data are not published in accordance with article 25 of the Law on Statistics. The publishing of individual data can be performed only in accordance with article 26 of the same law Individual data are not published in accordance with article 25 of the Law on Statistics. The publishing of individual data can be performed only in accordance with article 26 of the same law. |
| Comment | |
Download in SDMX 2.1 file format: PERFORMING ARTS - theaters, music and dance formations, recitals and concerts
Metadata Structure Definition in SDMX 2.1: ESQRS_MSD+BNSI+2.0+SDMX.2.1.xml
Download in SDMX 2.0 file format: PERFORMING ARTS - theaters, music and dance formations, recitals and concerts
Metadata Structure Definition in SDMX 2.0: ESQRS_MSD+BNSI+2.0+SDMX.2.0.xml
Publishing Production in 2024
In Bulgaria during 2024, 10 143 books and pamphlets were published, which is with 218 less than the previous year. The highest number was fiction for adults - 3 024 titles, followed by scientific literature - 2 256. The titles of translated publications were 2 598. More than half of them were translated from English (51.3%), followed by the editions from French - 10.2%, Russian - 6.9% and German - 6.1%. The highest number of books and pamphlets being published was in Sofia (stolitsa) district - 6 913, followed by Plovdiv (892) and Varna (451) districts.
In 2024...
Culture - Libraries, Cinemas, Film Production, Radio and TV Programme Activities, Performance Arts and Museums in 2024
In 2024, in Bulgaria were operating the following cultural institutions:
- 188 museums with museum collection of 7 733 thousand units;
- 81 theatres, which organized 16 586 performances;
- 49 libraries with library collection over 200 thousand library units;
- 84 cinemas with 240 cinema screens.
Publishing Production in 2023 (Published Books and Pamphlets and Continuing Editions)
In Bulgaria during 2023, 10 361 books and pamphlets were published, which is with 1 467 less than the previous year. The highest number was fiction for adults - 2 995 titles, followed by scientific literature - 2 136. The titles of translated publications were 2 688. More than half of them were translated from English (57.7%), followed by the editions from French - 8.4%, German - 5.9% and Russian - 5.9%. The highest number of books and pamphlets being published was in Sofia (stolitsa) district - 6 887, followed by Plovdiv (756) and Varna (625) districts.
In 202...
Main Data on Culture in the Republic of Bulgaria for 2023
In 2023 in Bulgaria were operating the following cultural institutions:
- 186 museums with museum collection of 7 848 thousand units;
- 83 theatres, which organized 16 125 performances, visited by 2 249 thousand viewers;
- 49 libraries with library collection over 200 thousand library units;
- 81 cinemas with 225 cinema screens.
Publishing Production in 2022 (Published Books and Pamphlets and Continued Editions)
In Bulgaria during 2022 were published 11 828 books and pamphlets, which is with 129 more than the previous year. With the highest number were the scientific issues 3 369 titles, followed by the fiction for adults – 1 891. The translated titles were 2 596, of which than half were translated from English (56.8%), followed by the editions translated from Russian – 6.4%, German – 5.7% and French – 5.5%. The highest number of books and pamphlets were published in Sofia (stolitsa) – 7 734, followed by Plovdiv (837) and Varna (670) districts.
In 2022...
Main Data on Culture in the Republic of Bulgaria for 2022
In 2022 in Bulgaria were operating the following cultural institutions:
- 186 museums with museum collection of 7 804 thousand units;
- 72 theatres, which organized 13 193 performances, visited by 1 712 thousand viewers;
- 49 libraries with library collection over 200 thousand library units;
- 85 cinemas with 227 cinema screens;
- 3 319 community cultural centers (chitalishte).
Publishing Production in 2021 (Published Books and Pamphlets and Continued Editions)
In Bulgaria during 2021 were issued:
- 11 700 books and pamphlets with circulation of 4 990 thousands
- 201 newspapers with circulation of 119 588 thousands
- 494 magazines and bulletins with circulation of 7 086 thousands
- 120 periodical collections with circulation of 19 thousands.
Main Data on Culture in the Republic of Bulgaria for 2021
In 2021 in Bulgaria, were operating the following cultural institutions:
- 184 museums with a museum collection of 7 624 thousand units;
- 71 theatres, which organized 9 970 performances, visited by 885 thousand viewers;
- 47 libraries with a library collection of over 200 thousand library units;
- 76 cinemas with 221 cinema screens.
Publishing Production in 2020 (Published Books and Pamphlets and Continued Editions)
In Bulgaria during 2020 were issued:
- 10 769 books and pamphlets with circulation of 5 893 thousands
- 209 newspapers with circulation of 123 287 thousands
- 519 magazines and bulletins with circulation of 8 416 thousands
- 101 periodical collections with circulation of 17 thousands.
Main Data on Culture in the Republic of Bulgaria for 2020
In 2020 in Bulgaria were operating the following cultural institutions:
• 182 museums with museum collection of 7 550 thousand units;
• 71 theatres, which organized 7 021 performances, visited by 769 thousand viewers;
• 47 libraries with library collection over 200 thousand library units;
• 70 cinemas with 215 cinema screens.
...Publishing Production in 2019 (Published Books and Pamphlets and Continued Editions)
In Bulgaria during 2019 were issued:
• 9 516 books and pamphlets with circulation of 7 628 thousands
• 223 newspapers with circulation of 169 261 thousands
• 595 magazines and bulletins with circulation of 9 016 thousands
• 140 periodical collections with circulation of 22 thousands.
Annual Statistical Surveys in the Field of Culture in 2019 - Main Results
In 2019 in Bulgaria were operating the following cultural institutions:
- 160 museums with museum collection of 7 529 thousand units;
- 74 theatres, which organized 15 955 performances, visited by 2 516 thousand viewers;
- 52 music formations;
- 47 libraries with library collection over 200 thousand library units;
- 74 cinemas with 237 cinema screens.
Publishing Production in 2018 (Published Books and Pamphlets and Continued Editions)
In Bulgaria during 2018 were issued:
• 9 842 books and pamphlets with circulation of 11 262 thousands
• 239 newspapers with circulation of 216 037 thousands
• ...
Annual Statistical Surveys in the Field of Culture in 2018 - Main Results
In 2018 in Bulgaria were operating the following cultural institutions:
• 174 museums with museum collection of 7 419 thousand units;
• 75 theatres, which organized 15 155 performances, visited by 2 389 thousand viewers;
Publishing Production in 2017 (Published Books and Pamphlets and Continued Editions)
In Bulgaria during 2017 were issued:
• 10 068 books and pamphlets with circulation of 6 710 thousands
• 245 newspapers with circulation of 196 288 thousands
• 603 magazines and bulletins with circulation of 16 982 thousands
• 114 periodical collections with circulation of 21 thousands.
Annual Statistical Surveys in the Field of Culture in 2017 - Main Results
In 2017 in Bulgaria were operating the following cultural institutions:
• 191 museums with museum collection of 7 406 thousand units;
• 74 theatres, in which were organized 15 333 performances, visited by 2 222 thousand viewers;
Main Results from the Survey on Community Cultural Centres Activities in 2017
The number of operating community clubs as of 31.12.2017 in Republic of Bulgaria was 3 321, from which 663 (20.0%) in urban and 2 658 (80.0%) in rural areas. In comparison to 2012 the number of community clubs had increased with 246. The register members were 272 797 and in comparison to 2012 there was observed an increase with 34 593 or with 14.5%.
...Publishing Production in 2016 (Published Books and Pamphlets and Continued Editions)
In Bulgaria during 2016 were issued:
• 8 530 Books and Pamphlets with circulation of 4 507 thousands
• 262 Newspapers с with circulation of 229 008 thousands
• 635 the Magazines and Bulletins with circulation of 17 265 thousands
• 108 Periodical collections with circulation of 21 thousands.
Annual Statistical Surveys in the Field of Culture in 2016 - Main Results
In 2016 in Bulgaria were operating the following cultural institutions:
• 195 museums with museum collection of 7 360 thousand units;
• 75 theatres, in which were organized 15 162 performances, visited by 2 295 thousand viewers;
Publishing Production in 2015 (Published Books and Pamphlets and Continued Editions)
In Bulgaria during 2015 were produced:
• 9 320 Books and Pamphlets with circulation of 4 904 thousands
• 283 Newspapers with circulation of 267 346 thousands
• 635 Magazines and Bulletins with circulation of 21 400 thousands
Annual Statistical Surveys in the Field of Culture in 2015 - Main Results
In 2015 in Bulgaria were operating the following cultural institutions:
• 201 museums with museum collection of 7 540 thousand units;
• 75 theatres, in which were organized 14 168 performances, visited by 2 169 thousand viewers;
• 56 music formations;&n...
Publishing Production in 2014 (Published Books and Pamphlets and Continued Editions)
In Bulgaria during 2014 were produced:
• 7 515 Books and Pamphlets with circulation of 4 031 thousands
• 295 Newspapers с with ...
Annual Statistical Surveys in the Field of Culture in 2014 - Main Results
As of 31.12.2014 in Bulgaria were functioned the followed cultured institutions: 204 museums with museum collection of 7 600 thousand units; 72 theatres, performed 14 694 performances and visited by 2 302 thousand viewers; 59 music formations; 48 libraries with library collection over 200 thousand library units, as well as 49 cinemas with 196 screens.
...Publishing Production in 2013 (Published Books and Pamphlets and Continued Editions)
In Bulgaria during 2013 was produced:
• 6 853 Books and pamphlets with circulation 4 445 thousands
• 307 Newspapers с with circulation 324 310 thousands
•...
Annual Statistical Surveys in the Field of Culture for 2013 - Main Results
The number of cultural institutions functioning in Bulgaria as of 31.12.2013 was:
• 187 museums with museum collection of 7 456 thousand units.
• 75 theatres, performed 14 463 pe...
Publishing Production (Published Books and Pamphlets and Continued Editions in 2012)
Annual Statistical Surveys in the Field of Culture for 2012 - Main Results
Statistical surveys conducted by the National Statistical Institute provide information on activities of museums, theatres, libraries, community clubs, cinemas, radio and television programmes activities and film productions. Main indicators and coverage are designed in accordance with methodological requirements of UNESCO and Eurostat....
Publishing Production (Continued Editions in 2011 and Books and Pamphlets Production for the Peroid October 2010 - December 2011)
Main Results from the Annual Statistical Surveys in the Field of Culture for 2011
Statistical surveys conducted by the National Statistical Institute are providing information on activities of museums, theatres, libraries, cinemas, radio and television programs and film productions. Main indicators and coverage are designed in accordance with methodological requirements of UNESCO and Eurostat....
Books and Pamphlets Production for the Peroid January - September 2010 and Continued Editions in 2010
The National Statistical Institute represents data on the publishing production in the country (books and pamphlets) and continued editions (newspapers and periodicals). Data source is the National Library "St. St. Cyril and Methodius”. Main indicators and coverage are designed in accordance with methodological requirements of UNESCO....
Main Results from the Annual Statistical Surveys in the Field of Culture for 2010
Statistical surveys conducted by the National Statistical Institute are providing information on activities of museums, theaters, libraries, cinemas, radio and television programs and film productions. Main indicators and coverage are designed in accordance with methodological requirements of UNESCO and Eurostat....
Statistical Reference Book 2025
The publication ‘Statistical Reference Book 2025’ is free and accessible for the users of statistical information in electronic format on the website of NSI.
The publication provides up-to-date information on the demographic processes and on the socio-economic and cultural life in the Republic of Bulgaria for the 2020 - 2024 period.
The presented information characterizes the national economy on macro level - Gross domestic product, investments, finances, balance of payments, as well as on separate economic activities - industry, agriculture, forestry, t...
Statistical Yearbook 2024
The National Statistical Institute (NSI) has the pleasure to present to the attention of national and foreign users of statistical information the 92nd edition of the ‘Statistical Yearbook of the Republic of Bulgaria’ in electronic format.
It provides current statistical information about the demographic, economic and social development of the country for 2018 - 2023 in different territorial and classification aggregations and breakdowns.
According to the Law on Statistics, the official source of information in the Republic of Bulgaria is the National Statistic...
Book publishing and Press 2023
The National Statistical Institute has the pleasure of presenting to the attention of the users of statistical information its new electronic publication Book publishing and Press 2023.
The publication contains statistical information on the development of publishing activity in Bulgaria by main indicators for 2023. Data by some indicators, such as: titles; circulation; average circulation of books, pamphlets, newspapers, magazines and bulletins for the period 1961 - 2023, are also included. The publication includes methodology notes and a brief analysis...
Statistical Reference Book 2024
Тhe National Statistical Institute presents to the users of statistical information the annual publication - Statistical Reference Book 2024 in English.
The Statistical Reference Book presents up-to-date information on the demographic processes as well as the economic, social and cultural development of the Republic of Bulgaria for the 2019 - 2023 period.
The publication presents data on main macroeconomic indicators of the national economy - gross domestic product, investments and finance; and economic acti...
Statistical Reference Book 2024 (Bulgarian version)
The National Statistical Institute presents to users of statistical information the annual publication - Statistical Reference Book 2024 in Bulgarian.
The Statistical Reference Book presents up-to-date information on the demographic processes as well as the economic, social and cultural development of the Republic of Bulgaria for the 2019 - 2023 period.
The publication presents data on main macroeconomic indicators of the national economy - gross domestic product, investments and finance; and economic activity groupings - industry, agriculture, forestry,...
Statistical Yearbook 2023
The National Statistical Institute (NSI) has the pleasure to present to the attention of national and foreign users of statistical information the 91-st edition of the ‘Statistical Yearbook of the Republic of Bulgaria’ in printed format.
It provides current statistical information about the demographic, economic and social development of the country for 2017 - 2022 in different territorial and classification aggregations and breakdowns.
According to the Law on Statistics, official source of information in the Republic of Bulgaria is the National Statistical Sys...
Book publishing and Press 2022
The National Statistical Institute has the pleasure of presenting users of statistical information with its new electronic publication, Book publishing and Press 2022.
The publication contains statistical information on the development of publishing activity in Bulgaria by main indicators for 2022.
Data by some indicators, such as: titles; circulation; average circulation of books, pamphlets, newspapers, magazines and bulletins for the period 1960 - 2022, are also included. The publication includes methodology notes and a brief analysis.
Statistical Reference Book 2023 (Bulgarian version)
The National Statistical Institute presents to users of statistical information the annual publication - Statistical Reference Book 2023 in Bulgarian.
The Statistical Reference Book presents topical information on the demographic processes as well as the economic, social and cultural development of the Republic of Bulgaria for the 2018 - 2022 period.
The publication presents data on main macroeconomic indicators of the national economy - gross domestic product, investments and finance; and economic activity groupings ...
Statistical Reference Book 2023

The National Statistical Institute presents to users of statistical information the annual publication - Statistical Reference Book 2023 in English.
The Statistical Reference Book presents topical information on the demographic processes as well as the economic, social and cultural development of the Republic of Bulgaria for the 2018 - 2022 period.
The publication presents data on main macroeconomic indicators of the national economy - gross domestic product, investments and finance; and economic activity groupings - industry, agriculture, fore...
Statistical Yearbook 2022
The National Statistical Institute (NSI) has the pleasure to present to the attention of national and foreign users of statistical information the 90th edition of the ‘Statistical Yearbook of the Republic of Bulgaria’ in printed format.
It provides current statistical information about the demographic, economic and social development of the country for 2016 - 2021 in different territorial and classification aggregations and breakdowns.
According to the Law on Statistics, official source of information in the Republic of Bulgaria is the National Statistical ...
Book publishing and Press 2021
The National Statistical Institute has the pleasure of presenting users of statistical information with its new electronic publication, Book publishing and Press 2021.
The publication contains statistical information on the development of publishing activity in Bulgaria by main indicators for 2021.
Data by some indicators, such as: titles; circulation; average circulation of books, pamphlets, newspapers, magazines and bulletins for the period 1960 - 2021, are also included. The publication includes methodology notes and a brief analysis.
The ...
Statistical Reference Book 2022
The National Statistical Institute presents to users of statistical information the annual publication - Statistical Reference Book 2022 in English.
The Statistical Reference Book presents topical information on the demographic processes as well as the economic, social and cultural development of the Republic of Bulgaria for the 2017 - 2021 period.
The publication presents data on main macroeconomic indicators of the national economy - gross domestic product, investments and finance; and economic activity groupings - industry, agriculture, ...
Statistical Reference Book 2022 (Bulgarian version)
The National Statistical Institute presents to users of statistical information the annual publication - Statistical Reference Book 2022 in Bulgarian.
The Statistical Reference Book presents topical information on the demographic processes as well as the economic, social and cultural development of the Republic of Bulgaria for the 2017 - 2021 period.
The publication presents data on main macroeconomic indicators of the national economy - gross domestic product, investments and finance; and economic activity groupings - industry, agriculture, fo...
Statistical Yearbook 2021
The National Statistical Institute (NSI) has the pleasure to present to the attention of national and foreign users of statistical information the 89th edition of the ‘Statistical Yearbook of the Republic of Bulgaria’ in printed and electronic format.
It provides current statistical information about the demographic, economic and social development of the country for 2015 - 2020 in different territorial and classification aggregations and breakdowns.
According to the Law on Statistics, official source of information in the Republic of Bulgaria is the ...
Book publishing and Press 2020
The National Statistical Institute has the pleasure to present of users on statistical information its new electronic publication Book publishing and Press 2020.
The publication contains statistical information on the development of publishing activity in Bulgaria by main indicators for 2020.
Data by some indicators, such as: titles; circulation; average circulation of books, pamphlets, newspapers, magazines and bulletins for the period 1960 - 2020, are also included. In the publication are applied methodology notes and...
Statistical Reference Book 2021
The National Statistical Institute presents to users of statistical information the annual publication - Statistical Reference Book 2021 in English.
The Statistical Reference Book presents topical information on the demographic processes as well as the economic, social and cultural development of the Republic of Bulgaria for the 2016 - 2020 period.
The publication presents data on main macroeconomic indicators of the national economy - gross domestic product, investments and finance; and economic activity groupings - industry, agriculture, forestry, ...
Statistical Reference Book 2021 (Bulgarian version)

The National Statistical Institute presents to users of statistical information the annual publication - Statistical Reference Book 2021 in Bulgarian.
The Statistical Reference Book presents topical information on the demographic processes as well as the economic, social and cultural development of the Republic of Bulgaria for the 2016 - 2020 period.
The publication presents data on main macroeconomic indicators of the national economy - gross domestic product, investments and finance; and economic activity groupings - industry, agri...
Statistical Yearbook 2020
The National Statistical Institute (NSI) has the pleasure to present to the attention of national and foreign users of statistical information the 88th edition of the ‘Statistical Yearbook of the Republic of Bulgaria’ in printed and electronic format.
It provides current statistical information about the demographic, economic and social development of the country for 2014 - 2019 in different territorial and classification aggregations and breakdowns.
According to the Law on Statistics, official source of information in the Republic of Bulgaria is the ...
Statistical Yearbook 2012
The National Statistical Institute (NSI) has the pleasure to submit to the attention of national and foreign users of statistical information the 80th edition of the ‘Statistical Yearbook of the Republic of Bulgaria’ in printed and electronic format.
It provides current statistical information about the demographic, economic and social development of the country for the 2007 - 2011 period in different territorial and classification aggregations and breakdowns.
Accor...
Book publishing and Press 2019
The National Statistical Institute has the pleasure to present of users on statistical information its new electronic publication Book publishing and Press 2019.
The publication contains statistical information on the development of publishing activity in Bulgaria by main indicators for 2019.
Data by some indicators, such as: titles; circulation; average circulation of books, pamphlets, newspapers, magazines and bulletins for the period 1960 - 2019, are also included. In the publication are applied methodology ...
Statistical Reference Book 2020
The National Statistical Institute presents to users of statistical information the annual publication - Statistical Reference Book 2020 in English.
The Statistical Reference Book presents topical information on the demographic processes as well as the economic, social and cultural development of the Republic of Bulgaria for the 2016 - 2019 period.
The publication presents data on main macroeconomic indicators of the national economy - gross domestic product, investments and finance; and economic activity groupings - industry, agriculture, forestry, ...
Statistical Reference Book 2020 (Bulgarian version)
The National Statistical Institute presents to users of statistical information the annual publication - Statistical Reference Book 2020 in Bulgarian.
The Statistical Reference Book presents topical information on the demographic processes as well as the economic, social and cultural development of the Republic of Bulgaria for the 2016 - 2019 period.
The publication presents data on main macroeconomic indicators of the national economy - gross domestic product, investments and finance; and economic activity groupings - industry, agriculture,...
Statistical Yearbook 2019
The National Statistical Institute (NSI) has the pleasure to present to the attention of national and foreign users of statistical information the 87th edition of the ‘Statistical Yearbook of the Republic of Bulgaria’ in printed and electronic format.
It provides current statistical information about the demographic, economic and social development of the country for 2013 - 2018 in different territorial and classification aggregations and breakdowns.
According to the Law on Statistics, official source of information in the Republic of Bulgaria is the ...
Book publishing and Press 2018

The National Statistical Institute has the pleasure to present of users on statistical information its new electronic publication Book publishing and Press 2018.
The publication contains statistical information on the development of publishing activity in Bulgaria by main indicators for 2018.
Data by some indicators, such as: titles; circulation; average circulation of books, pamphlets, newspapers, magazines and bulletins for the period 1960 - 2018, are also included. In the publication are applied methodology notes an...
Statistical Yearbook 2018 in infographics
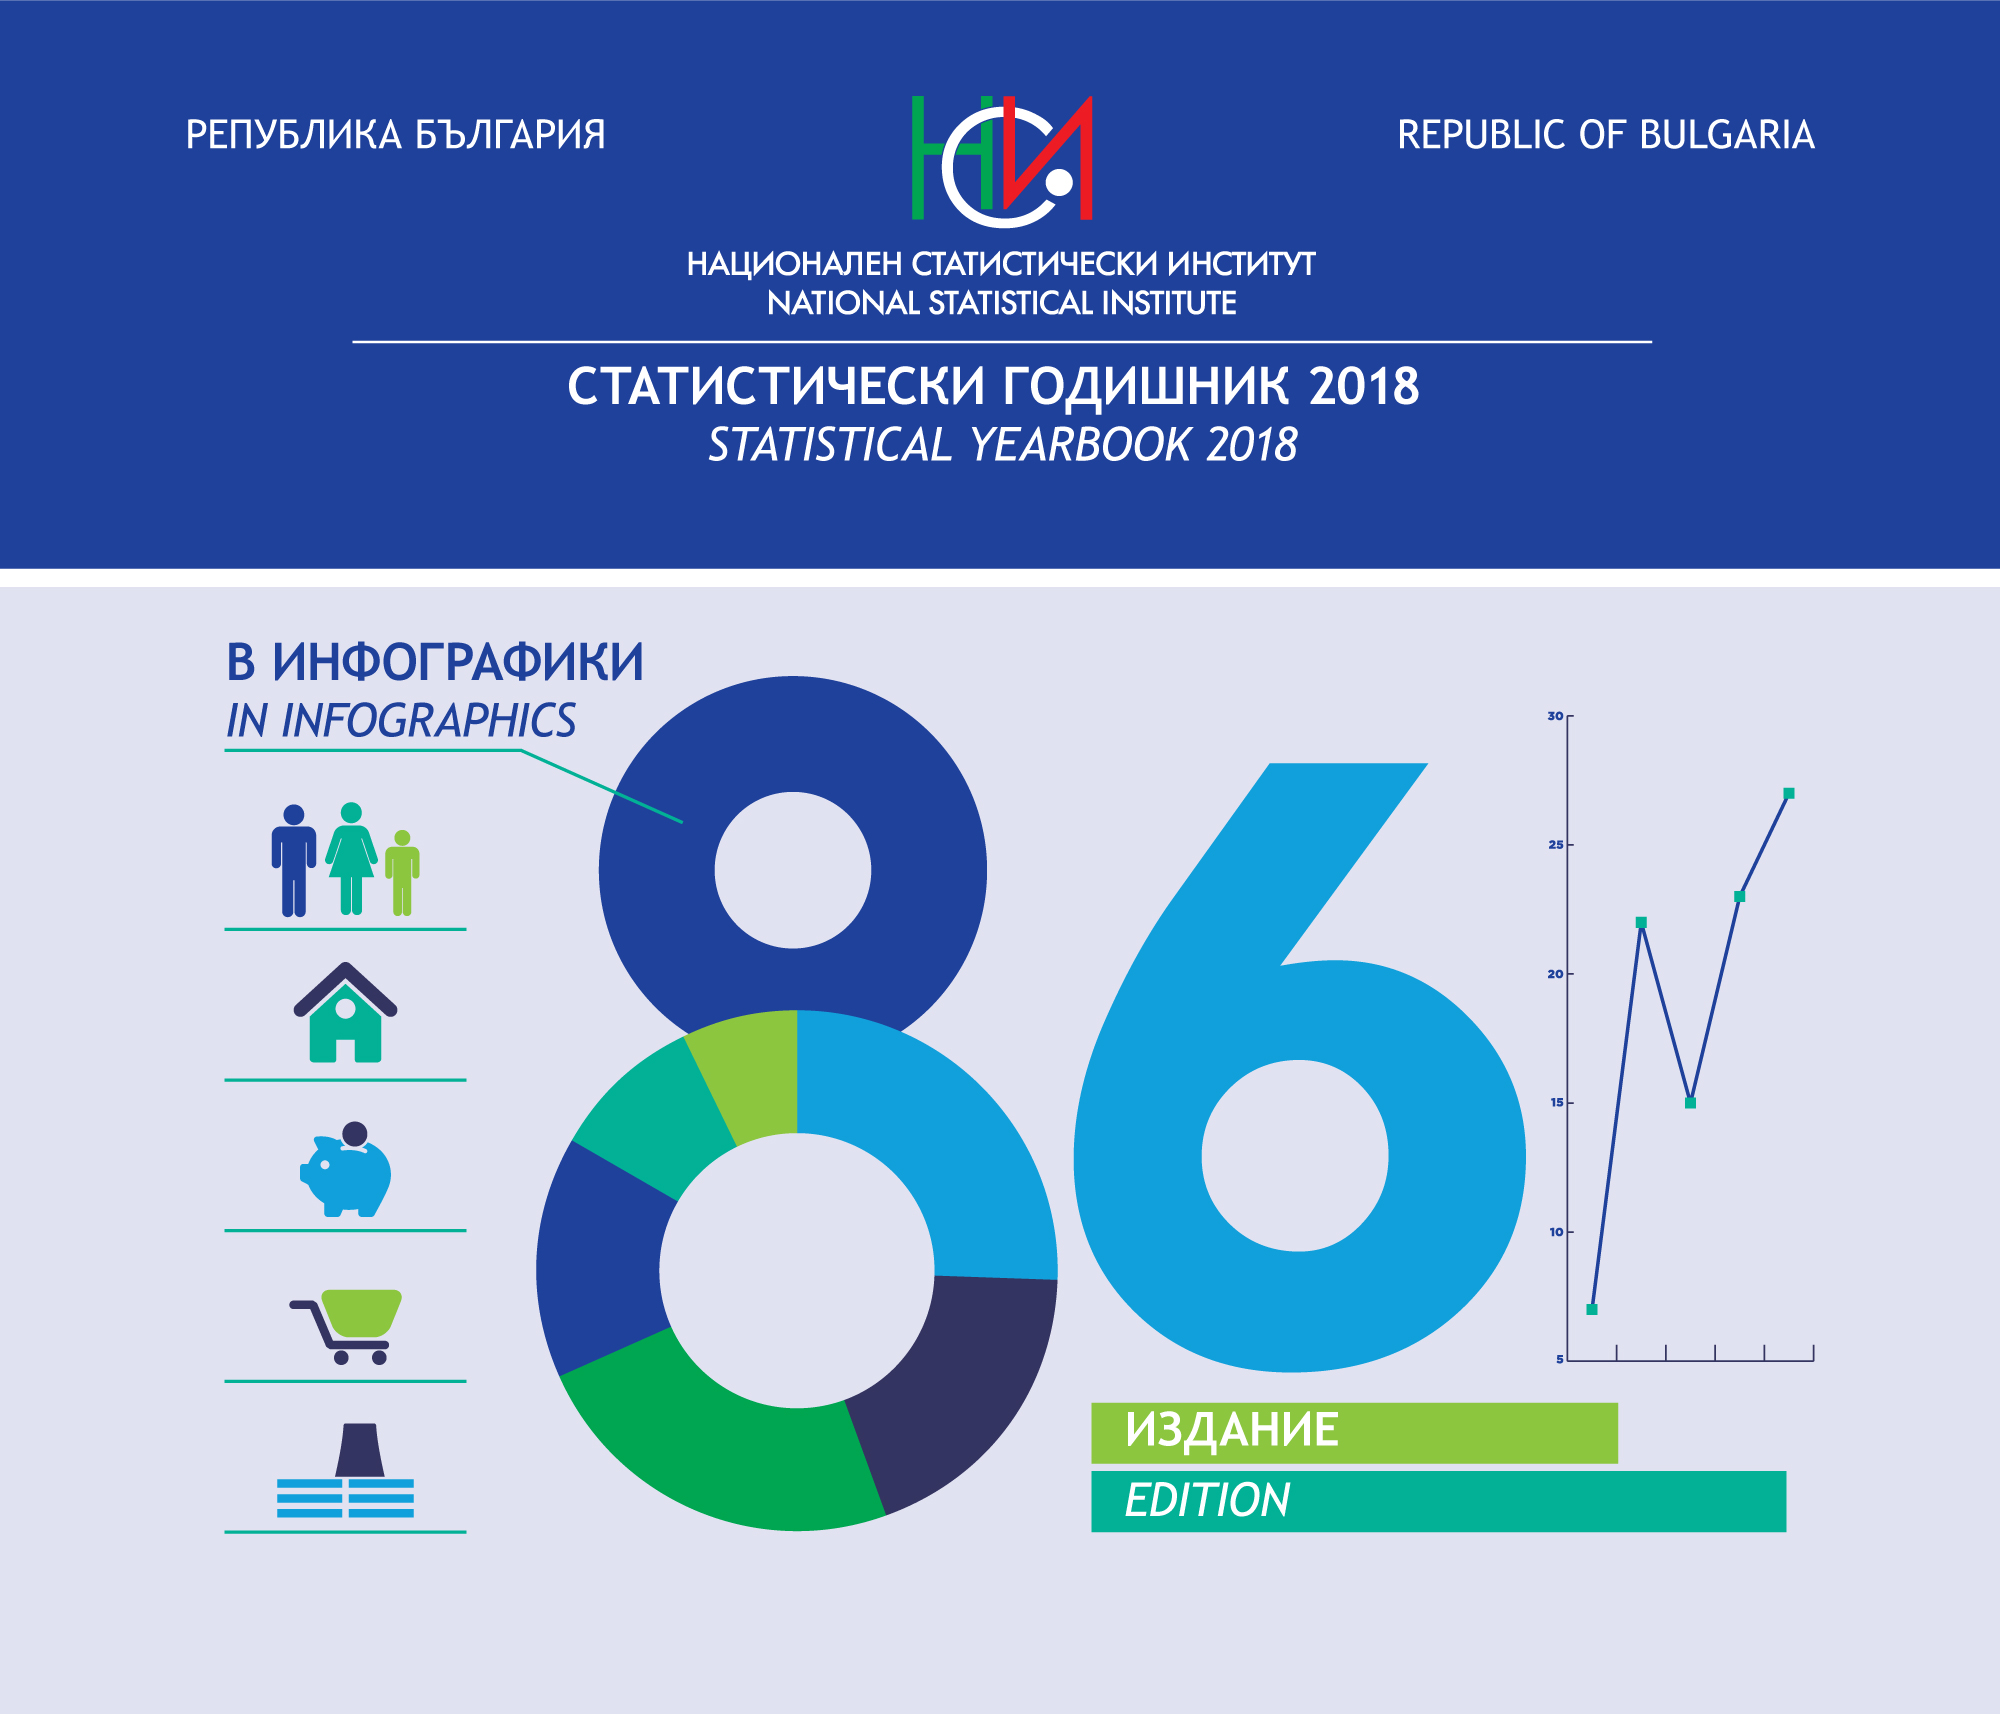
The National Statistical Institute presents to your attention the 86th edition of the Statistical Yearbook of the Republic of Bulgaria in infographics.
In 2018, for the first time, we presented the results of the statistical surveys through graphics, images and other visualization tools, which resulted in a positive response among a wide range of users. We believe that this modern way of presenting statistical information will trigger the interest in those who for the first time encounter the meaning of numbers revealing important aspects of socio-economic life.
...Statistical Reference Book 2019

The National Statistical Institute presents to users of statistical information the annual publication - Statistical Reference Book 2019 in English.
The Statistical Reference Book presents topical information on the demographic processes as well as the economic, social and cultural development of the Republic of Bulgaria for the 2015 - 2018 period.
The publication presents data on main macroeconomic indicators of the national economy - gross domestic product, investments and finance; and economic activity groupings - industry, agriculture, f...
Statistical Reference Book 2019 (Bulgarian version)

The National Statistical Institute presents to users of statistical information the annual publication - Statistical Reference Book 2019 in Bulgarian.
The Statistical Reference Book presents topical information on the demographic processes as well as the economic, social and cultural development of the Republic of Bulgaria for the 2015 - 2018 period.
The publication presents data on main macroeconomic indicators of the national economy - gross domestic product, investments and finance; and economic activity groupings - industry, agriculture, forestry, transp...
Statistical Yearbook 2018

The National Statistical Institute (NSI) has the pleasure to present to the attention of national and foreign users of statistical information the 86th edition of the ‘Statistical Yearbook of the Republic of Bulgaria’ in printed and electronic format.
It provides current statistical information about the demographic, economic and social development of the country for 2012 - 2017 in different territorial and classification aggregations and breakdowns.
According to the Law on Statistics, official source of information in the Republic of Bulgaria is the ...
Book publishing and Press 2017

The National Statistical Institute has the pleasure to present of users on statistical information its new electronic publication Book publishing and Press 2017.
The publication contains statistical information on the development of publishing activity in Bulgaria by main indicators for 2017.
Data by some indicators, such as: titles; circulation; average circulation of books, pamphlets, newspapers, magazines and bulletins for the period 1962 - 2017, are also included. In the publication are applied methodology notes and brief analysis.
Data are c...
Statistical Reference Book 2018
The National Statistical Institute presents to users of statistical information the annual publication - Statistical Reference Book 2018 in English.
The Statistical Reference Book presents topical information on the demographic processes as well as the economic, social and cultural development of the Republic of Bulgaria for the 2014 - 2017 period.
The publication presents data on main macroeconomic indicators of the national economy - gross domestic product, investments and finance; and economic activity groupings - industry, agriculture, f...
Statistical Yearbook 2017 in infographics

The National Statistical Institute of Bulgaria offers a different view of the statistical information included in the 85th edition of the Statistical Yearbook of the Republic of Bulgaria.
The publication is intended for a wider audience as statistical data are presented in a plain and easy understandable way.
The current state and changes in the socio-economic and cultural life in the country are presented not in the traditional way in tables and text, but through infographics - images, graphics and other visualization tools.
We belie...
Statistical Reference Book 2018 (Bulgarian version)
The National Statistical Institute presents to users of statistical information the annual publication - Statistical Reference Book 2018 in Bulgarian.
The Statistical Reference Book presents topical information on the demographic processes as well as the economic, social and cultural development of the Republic of Bulgaria for the 2014 - 2017 period.
The publication presents data on main macroeconomic indicators of the national economy - gross domestic product, investments and finance; and economic activity groupings - industry, agriculture, forestry, transp...
Statistical Yearbook 2017
The National Statistical Institute (NSI) has the pleasure to present to the attention of national and foreign users of statistical information the 84th edition of the ‘Statistical Yearbook of the Republic of Bulgaria’ in printed and electronic format.
It provides current statistical information about the demographic, economic and social development of the country for 2012 - 2016 in different territorial and classification aggregations and breakdowns.
According to the Law on Statistics, official source of information in the Republic of Bulgaria is the ...
Book publishing and Press 2016

The National Statistical Institute has the pleasure to present of users on statistical information its new electronic publication Book publishing and Press 2016.
The publication contains statistical information on the development of publishing activity in Bulgaria by main indicators for 2016.
Data by some indicators, such as: titles; circulation; average circulation of books, pamphlets, newspapers, magazines and bulletins for the period 1962 - 2016, are also included. In the publication are applied methodology notes an...
Statistical Reference Book 2017
The National Statistical Institute presents to users of statistical information the annual publication - Statistical Reference Book 2017 in English.
The Statistical Reference Book presents topical information on the demographic processes as well as the economic, social and cultural development of the Republic of Bulgaria for the 2013 - 2016 period.
The publication presents data on main macroeconomic indicators of the national economy - gross domestic product, investments and finance; and economic activity groupings - industry, agriculture, f...
Statistical Reference Book 2017 (Bulgarian version)
The National Statistical Institute presents to users of statistical information the annual publication - Statistical Reference Book 2017 in Bulgarian.
The Statistical Reference Book presents topical information on the demographic processes as well as the economic, social and cultural development of the Republic of Bulgaria for the 2013 - 2016 period.
The publication presents data on main macroeconomic indicators of the national economy - gross domestic product, investments and finance; and economic activity groupings - industry, agriculture, forestry, transp...
Statistical Yearbook 2016

The National Statistical Institute (NSI) has the pleasure to present to the attention of national and foreign users of statistical information the 84th edition of the ‘Statistical Yearbook of the Republic of Bulgaria’ in printed and electronic format.
It provides current statistical information about the demographic, economic and social development of the country for 2011 - 2015 in different territorial and classification aggregations and breakdowns.
According to the Law on Statistics, official source of information in the Republic of Bulgaria is the ...
Book publishing and Press 2015
The National Statistical Institute has the pleasure to present of users on statistical information its new electronic publication Book publishing and Press 2015.
The publication contains statistical information on the development of publishing activity in Bulgaria by main indicators for 2015.
Data by some indicators, such as: titles; circulation; average circulation of books, pamphlets, newspapers, magazines and bulletins for the period 1961 - 2015, are also included. In the publication are applied methodology notes and brief analysis.
Data are c...
Statistical Reference Book 2016

The National Statistical Institute presents to users of statistical information the annual publication - Statistical Reference Book 2016 in English.
The Statistical Reference Book presents topical information on the demographic processes as well as the economic, social and cultural development of the Republic of Bulgaria for the 2012 - 2015 period.
The publication presents data on main macroeconomic indicators of the national economy - gross domestic product, investments and finance; and economic activity groupings - industry, agriculture, forestry, transpor...
Statistical Reference Book 2016 (Bulgarian version)

The National Statistical Institute presents to users of statistical information the annual publication - Statistical Reference Book 2016 in Bulgarian.
The Statistical Reference Book presents topical information on the demographic processes as well as the economic, social and cultural development of the Republic of Bulgaria for the 2012 - 2015 period.
The publication presents data on main macroeconomic indicators of the national economy - gross domestic product, investments and finance; and economic activity groupings - industry, agriculture, forestry, transp...
Statistical Yearbook 2015
The National Statistical Institute (NSI) has the pleasure to present to the attention of national and foreign users of statistical information the 83rd edition of the ‘Statistical Yearbook of the Republic of Bulgaria’ in printed and electronic format.
It provides current statistical information about the demographic, economic and social development of the country for 2010 - 2014 in different territorial and classification aggregations and breakdowns.
According to the Law on Statistics, official source of information in the Republic of Bulgaria is the ...
Book publishing and Press 2014

The National Statistical Institute has the pleasure to present of users on statistical information its new electronic publication Book publishing and Press 2014.
The publication contains statistical information on the development of publishing activity in Bulgaria by main indicators for 2014.
Data by some indicators, such as: titles; circulation; average circulation of books, pamphlets, newspapers, magazines and bulletins for the period 1960 - 2014, are also included. In the publication are applied methodology notes and brief analysis.
Data are c...
Statistical Reference Book 2015

The National Statistical Institute presents to users of statistical information the annual publication - Statistical Reference Book 2015 in English.
The Statistical Reference Book presents topical information on the demographic processes as well as the economic, social and cultural development of the Republic of Bulgaria for the 2010 - 2014 period.
The publication presents data on main macroeconomic indicators of the national economy - gross domestic product, investments and finance; and economic activity groupings - industry, agriculture, forestry, transport, c...
Statistical Reference Book 2015 (Bulgarian version)
The National Statistical Institute presents to users of statistical information the annual publication - Statistical Reference Book 2015 in Bulgarian.
The Statistical Reference Book presents topical information on the demographic processes as well as the economic, social and cultural development of the Republic of Bulgaria for the 2010 - 2014 period.
The publication presents data on main macroeconomic indicators of the national economy - gross domestic product, investments and finance; and economic activity groupings - industry, agriculture, forestry, transport,...
Statistical Yearbook 2014
The National Statistical Institute (NSI) has the pleasure to present to the attention of national and foreign users of statistical information the 82nd edition of the ‘Statistical Yearbook of the Republic of Bulgaria’ in printed and electronic format.
It provides current statistical information about the demographic, economic and social development of the country for 2009 - 2013 in different territorial and classification aggregations and breakdowns.
According to the Law on Statistics, official source of information in the Republic of Bulgaria is the Nati...
Book publishing and Press 2013

The National Statistical Institute has the pleasure to present of users on statistical information its new electronic publication Book publishing and Press 2013.
The publication contains statistical information on the development of publishing activity in Bulgaria by main indicators for 2013.
Data by some indicators, such as: titles; circulation; average circulation of books, pamphlets, newspapers, magazines and bulletins for the period 1960 - 2013, are also included. In the publication are applied methodology notes and brief analysis.
Da...
Statistical Reference Book 2014

The National Statistical Institute presents to users of statistical information the annual publication - Statistical Reference Book 2014 in English.
The Statistical Reference Book presents topical information on the demographic processes as well as the economic, social and cultural development of the Republic of Bulgaria for the 2009 - 2013 period.
The publication presents data on main macroeconomic indicators of the national economy - gross domestic product, investments and finance; and economic activity groupings - industry, agriculture, forestry, tran...
Statistical Reference Book 2014 (Bulgarian version)

The National Statistical Institute presents to users of statistical information the annual publication - Statistical Reference Book 2014 in Bulgarian.
The Statistical Reference Book presents topical information on the demographic processes as well as the economic, social and cultural development of the Republic of Bulgaria for the 2009 - 2013 period.
The publication presents data on main macroeconomic indicators of the national economy - gross domestic product, investments and finance; and economic activity groupings - industry, agriculture, forestry, tr...
Statistical Yearbook 2013

The National Statistical Institute (NSI) has the pleasure to present to the attention of national and foreign users of statistical information the 81st edition of the ‘Statistical Yearbook of the Republic of Bulgaria’ in printed and electronic format.
It provides current statistical information about the demographic, economic and social development of the country for 2008 - 2012 in different territorial and classification aggregations and breakdowns.
According to the Law on Statistics, official source of information in the Republic of Bulgaria is the Nati...
Book publishing and Press 2012

The National Statistical Institute has the pleasure to present of users on statistical information its new electronic publication Book publishing and Press 2012.
The publication contains statistical information on the development of publishing activity in Bulgaria by main indicators for 2012.
Data by some indicators, such as: titles; circulation; average circulation of books, pamphlets, newspapers, magazines and bulletins for the period 1960-2012, are also included. In the publication are applied methodology notes ...
Statistical Reference Book 2013
The National Statistical Institute presents to users of statistical information the annual publication - Statistical Reference Book 2013 in English.
The Statistical Reference Book presents topical information on the demographic processes as well as the economic, social and cultural development of the Republic of Bulgaria for the 2008 - 2012 period.
The publication presents data on main macroeconomic indicators of the national economy - gross domestic product, investments and finance; and economic activity groupings - industry, agric...
Statistical Reference Book 2013 (Bulgarian version)

The National Statistical Institute presents to users of statistical information the annual publication - Statistical Reference Book 2013 in Bulgarian.
The Statistical Reference Book presents topical information on the demographic processes as well as the economic, social and cultural development of the Republic of Bulgaria for the 2008 - 2012 period.
The publication presents data on main macroeconomic indicators of the national economy - gross domestic product, investments and finance; and economic activity groupings - industry, agr...
Book-publishing and Press 2011

The National Statistical Institute presents the issued annual bilingual (Bulgarian-English) publication Book-publishing and Press 2011.
The publication contains statistical information on the development of publishing activity in Bulgaria by main indicators for 2011. The data for books and pamphlets are for the first nine months of 2011. Data for last three months of 2011 will be included in the survey in 2012.
Data by some indicators, such as: titles; circulation; average circulation of books, pamphlets, newspapers, magazines and b...
Statistical Reference Book 2012
The National Statistical Institute presents to users of statistical information the annual publication - Statistical Reference Book 2012 in English.
The Statistical Reference Book represents topical information on the demographic processes as well as the economic, social and cultural development of the Republic of Bulgaria for the 2007 - 2011 period.
The publication presents data on main macroeconomic indicators of the national economy - gross domestic product, investments and finance; and economic activity groupings - industry, agr...
Statistical Reference Book 2012 (Bulgarian version)

The National Statistical Institute presents to users of statistical information the annual publication - Statistical Reference Book 2012 in Bulgarian.
The Statistical Reference Book presents topical information on the demographic processes as well as the economic, social and cultural development of the Republic of Bulgaria for the 2007 - 2011 period.
The publication presents data on main macroeconomic indicators of the national economy - gross domestic product, investments and finance; and economic activity groupings&...
Statistical Yearbook 2011
The National Statistical Institute (NSI) has the pleasure to submit to the attention of national and foreign users of statistical information the 79th edition of the ‘Statistical Yearbook of the Republic of Bulgaria’ in printed and electronic format.
It provides current statistical information about the demographic, economic and social development of the country for the 2005 - 2010 period in different territorial and classification aggregations and breakdowns.
According ...
Book-publishing and Press 2010

The National Statistical Institute presents the issued annual bilingual (Bulgarian-English) publication Book-publishing and Press 2010.
The publication contains statistical information on the development of publishing activity in Bulgaria by main indicators for 2010. The data for books and pamphlets are for the first nine months of 2010. Data for other three months of 2010 will be included in the survey in 2011.
Data by some indicators, such as: titles; circulation; average circulation of books, pamphlets, newspapers, magazines and ...
Statistical Reference Book 2011
The National Statistical Institute presents to users of statistical information the annual publication - Statistical Reference Book 2011 in English. It is a concise form of the same issue in Bulgarian.
The Statistical Reference Book presents topical information on the demographic processes as well as the economic, social and cultural development of the Republic of Bulgaria for the 2006 - 2010 period.
The publication presents data on main macroeconomic indicators of the national economy - gross domestic product, investments...
Statistical Yearbook 2010
The National Statistical Institute (NSI) has the pleasure to submit to the attention of national and foreign users of statistical information the 78th edition of the ‘Statistical Yearbook of the Republic of Bulgaria’ in printed and electronic format.
It provides current statistical information about the demographic, economic and social development of the country for the 2004 - 2009 period in different territorial and classification aggregations and breakdowns.
Accor...
Statistical Yearbook 2009
The National Statistical Institute (NSI) has the pleasure to submit to the attention of national and foreign users of statistical information the 77th edition of the ‘Statistical Yearbook of the Republic of Bulgaria’ in printed and electronic format. The issue is published in 2010, which marks 130 years since the establishment of a statistical institution in Bulgaria and 100 years since publishing of the first ‘Statistical Yearbook of the Bulgarian Kingdom’ in 1910.
This issue has new design and layout. It provides current statistical information about ...
Statistical Reference Book 2010
The National Statistical Institute presents to users of statistical information the annual publication - Statistical Reference Book 2010 in English. It is a concise form of the same issue in Bulgarian.
The Statistical Reference Book presents topical information on the demographic processes as well as the economic, social and cultural development of the Republic of Bulgaria for the 2005 - 2009 period.
The publication presents data on main macroeconomic indicators of the national economy - gross domestic product, investments...
Book-publishing and Press 2009
The National Statistical Institute presents the issued annual bilingual (Bulgarian-English) publication Book-publishing and Press 2009.
The National Statistical Institute has the pleasure to present of users on statistical information its new electronic publication “Book publishing and Press”.
The publication contains statistical information on the development of publishing activity in Bulgaria by main indicators for 2009. Data by some indicators, such as: titles; circulation; average circulation of books, pamphlets, newspapers, magazines and...
Statistical Reference Book 2009
The National Statistical Institute presents to users of statistical information the annual publication - Statistical Reference Book 2009 in English. It is a concise form of the same issue in Bulgarian.
The issue is with a new design and enrich contents. For the first time are included methodological and analytic notes towards all chapters. The information is illustrated with a rich graphic materials.
The Statistical Reference Book presents topical information on the demographic processes as well as the economic, social and cultural ...
Book Publishing and Press 2008

The National Statistical Institute presents to the users of statistical information annual electronic (on CD-ROM) publication Book-publishing and Press 2008.
The publication contains statistical information on the development of publishing activity in Bulgaria by main indicators for 2008. Data by some indicators, such as: titles; circulation; average circulation of books, pamphlets, newspapers, magazines and bulletins for the 1960 - 2008 period, are also included. In the publication are also included methological notes and brief analysis.
Dat...
Statistical Yearbook 2008
The National Statistical Institute has the pleasure to submit to the attention of national and foreign users of statistical information the 76th edition of the Statistical Yearbook of the Republic of Bulgaria 2008. It provides topical statistical information on the demographic, economic and social development of the country for the 2002 - 2007 period in different territorial and classification aggregations and breakdowns.
According to the Law on Statistics, official source of information in the Republic of Bulgaria is the National Statistical System, wh...
Statistical Reference Book of the Republic of Bulgaria 2008
The National Statistical Institute presents to users of statistical information one of its main publications - Statistical Reference Book of the Republic of Bulgaria 2008 in English. It is a concise form of the same issue in Bulgarian.
The Statistical Reference Book presents topical information on the demographic processes as well as the economic, social and cultural development of the Republic of Bulgaria for the 2004 - 2007 period.
The publication presents data on main macroeconomic indicators of the national economy - gross dom...


